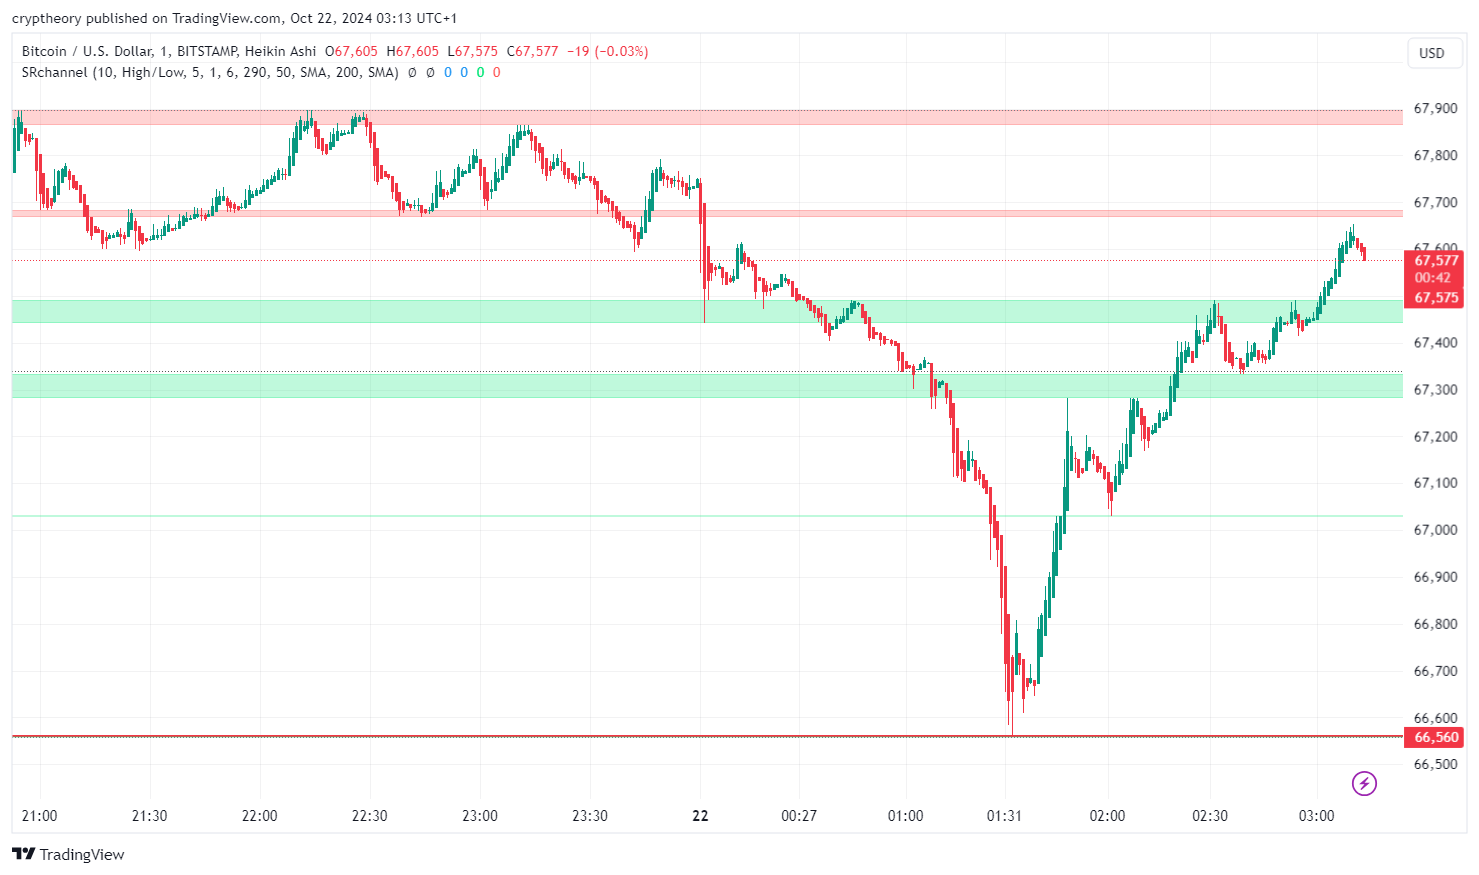
Today’s Bitcoin price action reflects a period of high volatility, as shown in the provided chart. The market started with Bitcoin hovering around the $67,600 mark but faced a sharp sell-off, dropping to a low of $66,560. This decline indicated strong selling pressure, possibly triggered by market news or large-scale liquidations.
Despite this dip, Bitcoin managed a swift recovery, pushing through key support zones highlighted around $66,700 and $67,300. Bulls regained momentum, driving the price back up toward the $67,600 resistance level.

This bounce suggests that buyers stepped in around the major support at $66,560, indicating strong buying interest at lower levels. The price then reclaimed the mid-range zone ($67,300), which may now act as a pivotal point for further upward momentum.
Currently, the main resistance level is seen around $67,800. If Bitcoin successfully breaks above this level, it could trigger a continuation of the bullish trend. On the other hand, failure to sustain above $67,600 could result in consolidation or a potential retest of lower support zones.
In conclusion, the market showed resilience with buyers stepping in at key support levels. It remains crucial to monitor if Bitcoin can sustain above the mid-range zone or if increased selling pressure will challenge the bullish momentum again.
Bitcoin price analysis (22/10/2024) – Key indicators
1. Relative Strength Index (RSI)
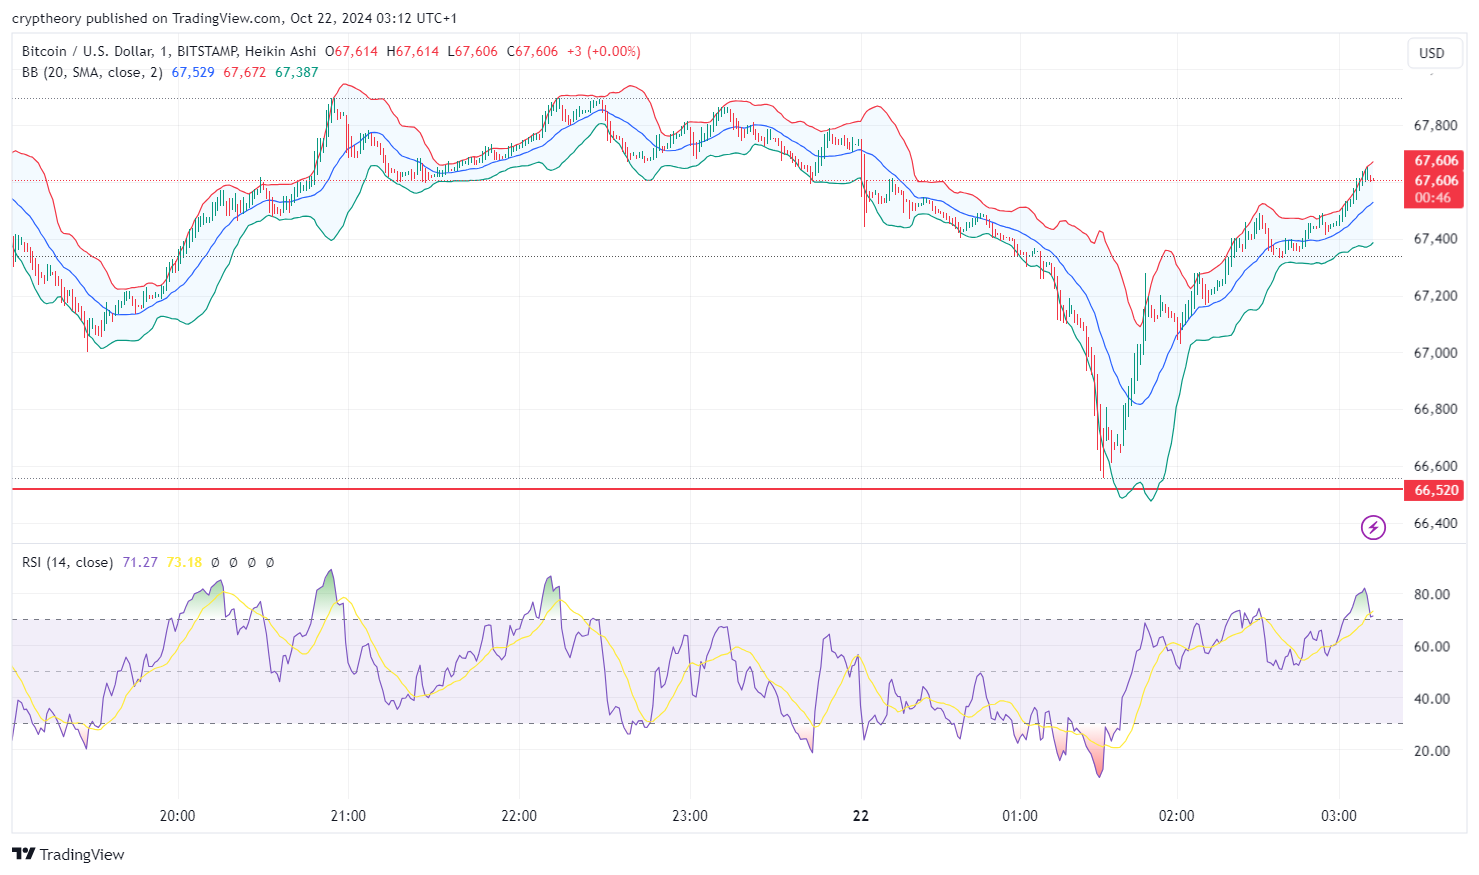
RSI is currently at 71.27, indicating that Bitcoin is nearing overbought territory. An RSI above 70 often suggests that the asset could be overbought, which may lead to a correction if upward momentum decreases.
2. Bollinger Bands
Bollinger Bands on the chart show a widening pattern, indicating increased volatility. The price recently rebounded from the lower band near $66,520 and is now trading close to the upper band near $67,606. This suggests strong buying pressure.
3. MACD
General observations would suggest that if a recent crossover occurred with the MACD line moving above the signal line, it indicates bullish momentum.
Overall, Bitcoin price appears to be in a recovery phase, with caution advised due to high RSI values.
- Michaël van de Poppe: Bitcoin to Hit $500,000 This Cycle? 🚀💸 Or Just Another Crypto Fairy Tale? - December 21, 2024
- What is the Meme Coin Bonk, Price Predictions 2025–2030, and Why Invest in BONK? - December 18, 2024
- BNB Price Analysis: 17/12/2024 – To the Moon or Stuck on a Layover? - December 17, 2024


