Welcome aboard, fellow crypto adventurers, to the wild ride that is Bitcoin! As we navigate through the twists and turns of October 25, 2024, strap in, because this is no smooth sailing – it’s more like trying to ride a bull during a moonshot. 🌙🐂
A Dip for the Brave 💀
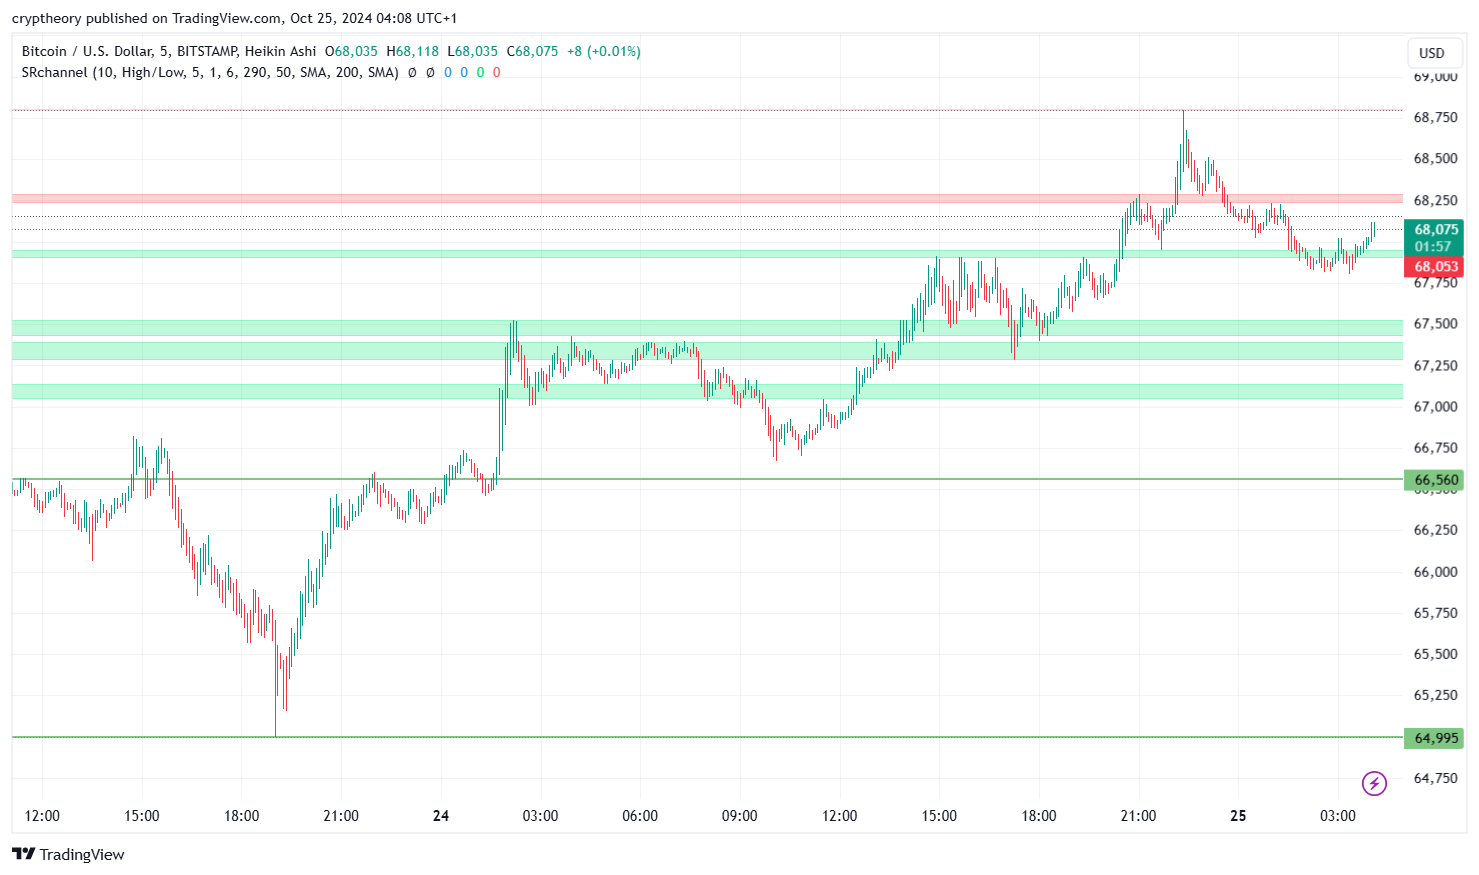
Our tale begins with Bitcoin dipping down to $66,560, a level where only the bravest HODLers dare look. Those who had diamond hands and nerves of steel were rewarded for staring into the abyss, as Bitcoin decided that it had spent enough time down in the dungeons of crypto purgatory. But like a phoenix rising from the ashes (or maybe more like a rocket powered by sheer meme energy), Bitcoin shot back up.

The Bounce: From Doom to Boom 🚀
In what can only be described as “Bitcoin being Bitcoin,” the price rebounded like a kid on a trampoline, bouncing its way back up to the $68,000 mark. Cue the sighs of relief from all the traders who nearly spilled their coffee. And let’s not forget the ones who FOMO’d in after the bounce, thinking they were about to ride the next great bull run into glory. Spoiler alert: not so fast, folks.
Resistance, the Kryptonite to Bulls 🐂🛑
Ah, resistance. Bitcoin met a classic red zone around $68,250, a place it tried to conquer but was sent packing by the crypto overlords. The rejection was swift, almost like Bitcoin hit a wall and muttered, “Nope, not today.” This gave bears a chance to come out of hibernation and remind everyone that they still exist. Bitcoin tried one last time to crack through but had to settle back down around $68,000. Close, but no cigar.
Support Levels: Where Bitcoin Feels at Home 🏡
On the other side of the battlefield, the trusty support levels at $67,750 stood strong like a fortress. Every time Bitcoin tried to drop back down, it found solace in these green zones. It’s like Bitcoin kept getting tired from all the moon-chasing and decided to take a breather on the comfortable couch of $67,750, much to the bulls’ relief.
Looking Ahead: A Battle of Wills ⚔️
What does the future hold? Will Bitcoin muster the strength to break through that pesky $68,250 resistance and head for greener pastures? Or will it retreat back to lower levels, maybe testing the patience of traders once again near $66,560? Only time will tell – and maybe Elon’s next tweet.
Conclusion: Bitcoin, Always Keeping Us on Our Toes 🕺
In summary, Bitcoin has once again proven that it’s the crypto world’s favorite roller coaster, taking us from the depths of $66,560 to the highs of $68,250, all while reminding us why we love (and sometimes hate) this volatile market. So buckle up, fellow traders, because who knows what Bitcoin has in store for us next. But whatever happens, one thing is certain: it’s going to be a wild ride. 🎢
RSI (Relative Strength Index):
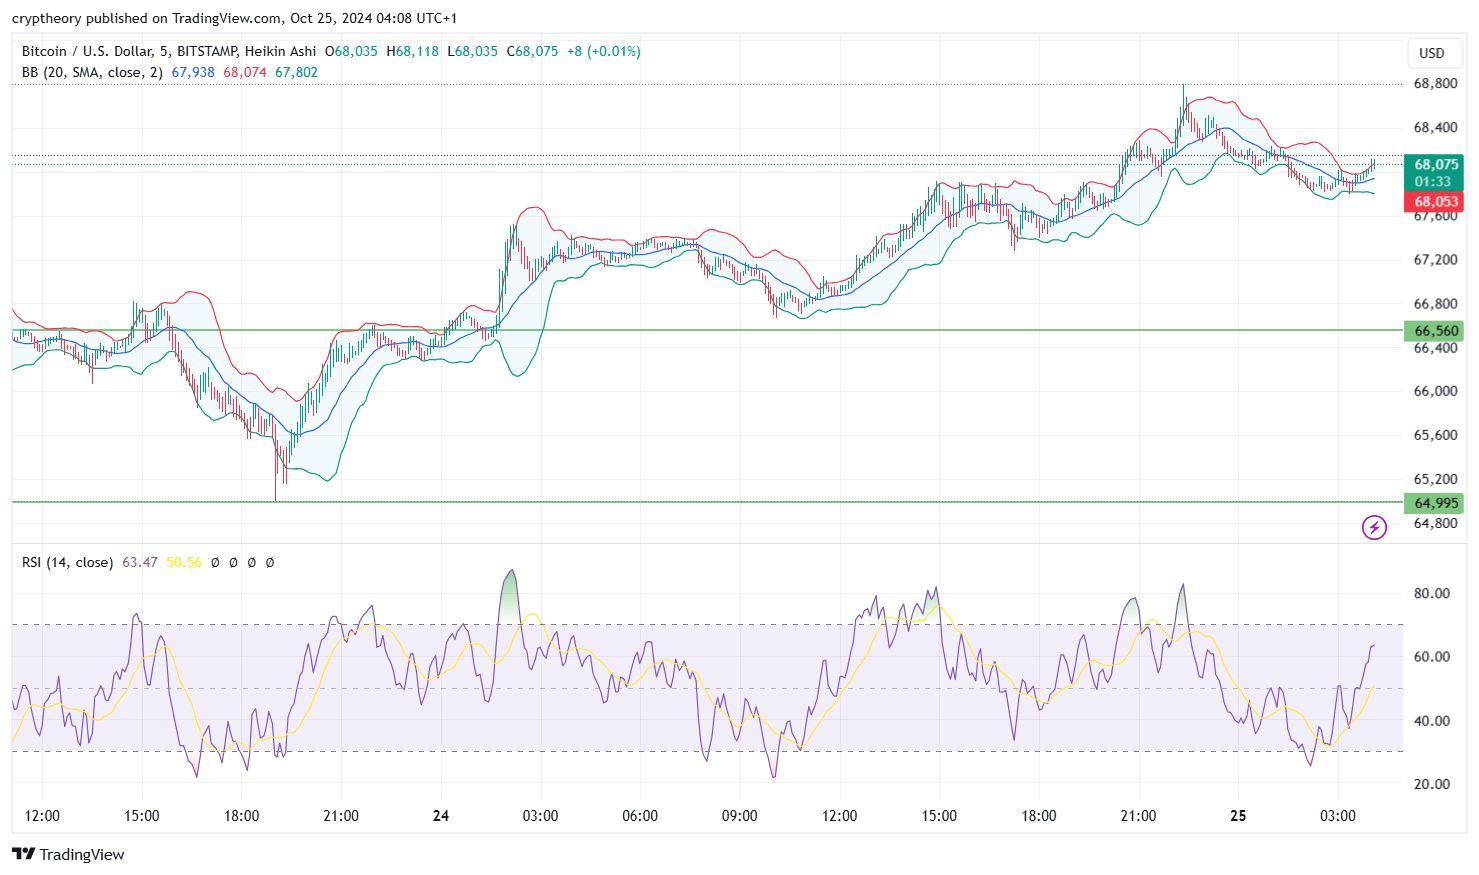
- The current RSI is at 63.47, which indicates that Bitcoin is nearing overbought territory. An RSI above 70 typically signals overbought conditions, possibly leading to a correction. For now, the value suggests bullish momentum, but it’s close to the overbought threshold.
Bollinger Bands:
- The middle band is positioned at 67,938, representing the 20-period simple moving average (SMA). The price is fluctuating around this middle band, suggesting potential consolidation in this range.
- The upper band is at 68,074, indicating resistance. When the price hits this upper band, it may indicate that the asset is overbought, which is supported by the RSI nearing higher levels.
- The lower band is at 67,802, representing the support level. If the price moves toward this lower band, it could indicate that the asset is becoming oversold, leading to a potential bounce.
RSI-based Moving Average (RSI-based MA):
- The yellow line on the RSI plot represents the RSI-based moving average. When the RSI moves above this MA, it suggests bullish momentum, while crossing below signals a potential bearish shift. In the current chart, the RSI is moving upward toward the MA, suggesting growing bullish sentiment.
In summary, the current indicators show a bullish trend, but with the RSI nearing overbought territory, caution is advised. If the price touches the upper Bollinger band, a short-term correction could follow.
Stay tuned, and may your stops be tight and your FOMO in check!
- What Could Bitcoin’s Price Be in 25 Years? A Lambo or Just a Latte?” 🚀💸 - December 23, 2024
- Solana Price Analysis – December 18, 2024: The Slippery Slope of SOL 🚀📉 - December 18, 2024
- Bitcoin Price Analysis – 16/12/2024: A Dance in the Ascending Channel - December 16, 2024


