Table of Contents
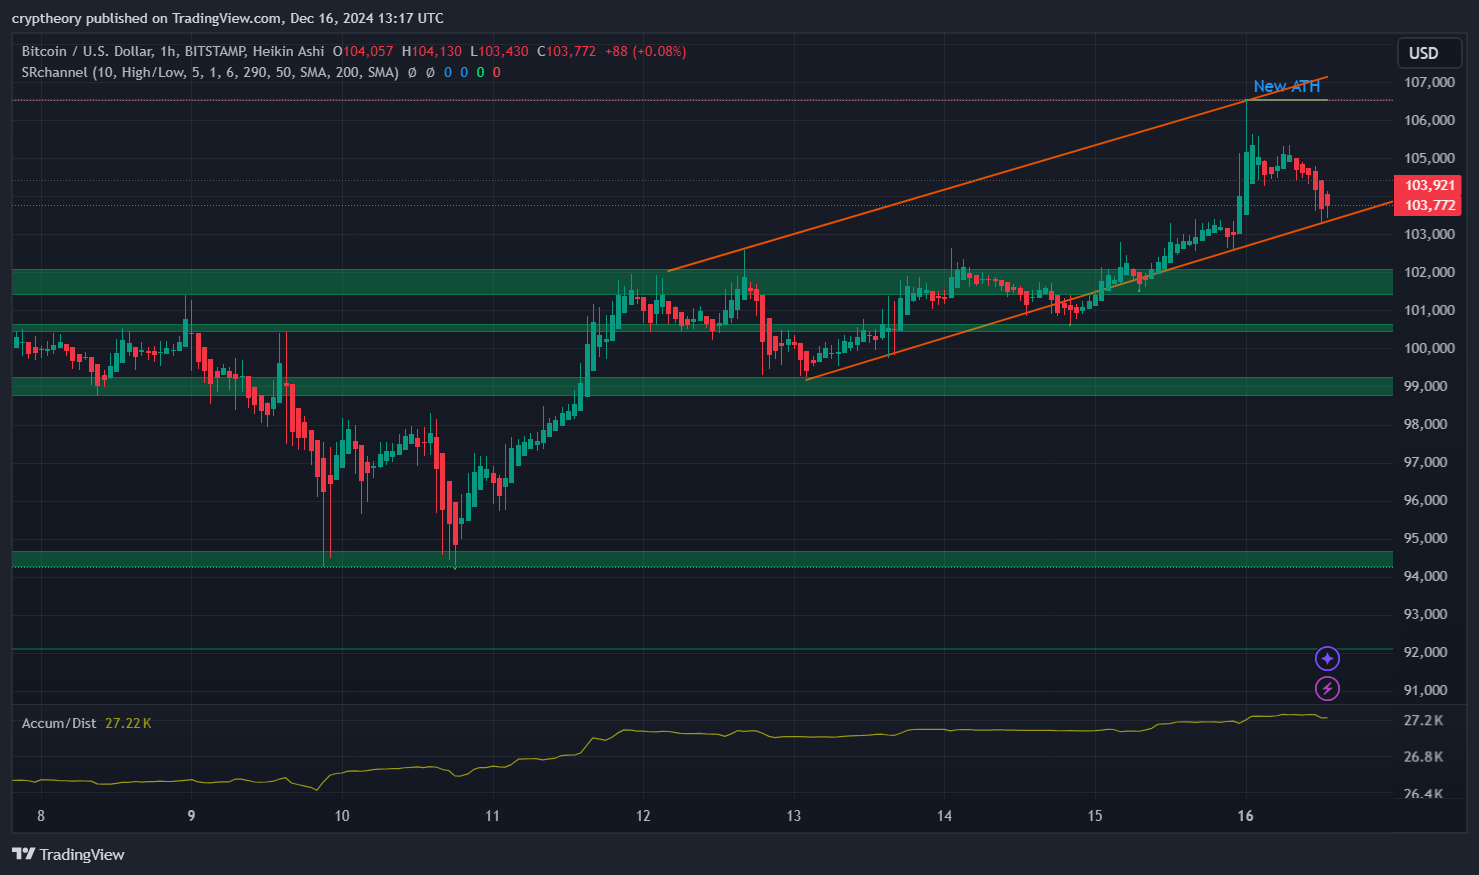
Ladies, gentlemen, and Bitcoin maxis, today’s chart looks like a masterpiece crafted by Picasso during his crypto phase—sharp, structured, and oh-so-expressive. Bitcoin, currently priced at $103,772, is moving in an ascending channel like a professional ballet dancer, toe-tapping between support and resistance. We’ve even hit a New All-Time High (ATH)—cue the laser eyes and celebratory memes!

The Chart Setup: An Ascending Channel Drama
Our beloved Bitcoin is dancing between two orange lines, forming a picture-perfect ascending channel. Think of this channel as a racetrack: the upper trendline acts as the ceiling, and the lower trendline is the floor—keeping the bulls and bears in check as they race toward dominance. BTC’s recent climb to over $106,000 set a new ATH, but just as we started popping champagne, the price corrected back below $104,000. Classic Bitcoin, always keeping us humble.
Support Zones: Where Bulls Have Set Up Camp
- $103,000: Acting as immediate support and our current testing ground. If this level holds, bulls may rally for a rematch at the ATH.
- $101,000 – $102,000: A cozy green zone where buyers previously piled in, ready to defend Bitcoin like knights guarding a castle.
- $99,000: Below this, things might get spooky. Bears would start whispering “collapse,” and traders might clutch their wallets nervously.
Resistance Zones: Where Bears Stand Tall
- $105,000: Acting as short-term resistance, this is the next hurdle for bulls to reclaim.
- $106,000+: The New ATH zone—Bitcoin’s shiny trophy. Breaking this convincingly would open doors to new uncharted highs, and we all know what happens then… “When moon, sir?!”
- $107,000: A dream level for bulls, but bears are sharpening their claws here.
Accumulation/Distribution (A/D) Indicator: Smart Money Clues
The A/D line shows 27.22K, suggesting modest accumulation but not full-on whale feasting. Smart money seems cautiously optimistic, nibbling at Bitcoin like it’s a high-stakes appetizer.

Bollinger Bands:
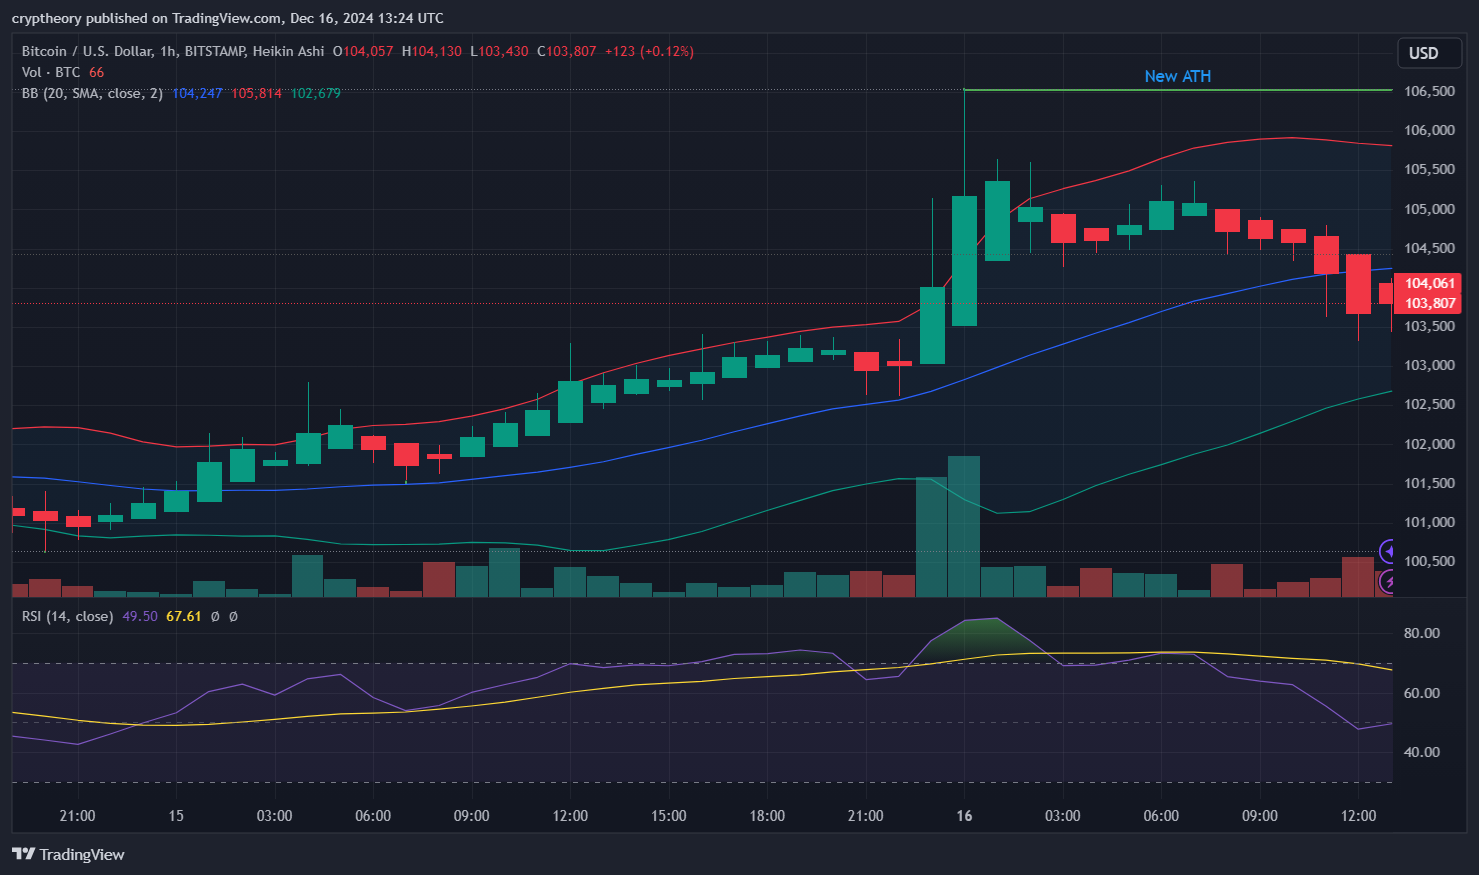
- Upper Band: 105,814 – indicating a resistance level where the price recently tested near the new ATH.
- Middle Band (SMA 20): 104,247 – acting as the dynamic support, closely hugging the price movement.
- Lower Band: 102,679 – providing support in case of further retracement.
RSI (Relative Strength Index):
- Current RSI Value (14): 49.50 – near the neutral zone, showing no overbought or oversold conditions.
- RSI Trend: Declining from earlier highs, reflecting weakening bullish momentum.
RSI-Based Moving Average:
- RSI MA: 67.61 – previously hovering in the bullish territory but now reflecting a cooling-off phase.
Volume:
- Volume Spikes: Noticeable volume surge during the sharp price rally to the New ATH, signaling strong buying pressure.
- Current Volume: Gradual decline in volume as price retraced, indicating reduced trading activity and weaker buyer enthusiasm.
Summary:
The Bollinger Bands are widening, signaling higher volatility, with price currently near the middle band at 104,247. The RSI is cooling off near 50, while the RSI MA remains higher at 67.61, suggesting earlier bullish momentum has slowed. Volume confirms this slowdown as buying activity tapers off after testing the upper resistance.
Key Observations:
- New ATH: BTC punched through the psychological ceiling and screamed “I’m back!” before retracing a bit. A retest of the ATH is likely if bulls stay hungry.
- Rising Volume Spike: Notice that volume jumped sharply as BTC rocketed to $106K—this signals strong buying pressure at the top, but caution as price retraced.
- Lower Support Test: We’re now sitting just above the lower channel trendline. If this support holds, prepare for another bullish rally attempt.
Scenarios to Watch:
Bullish Scenario: Reclaim the ATH, Bring on $107K
If bulls defend $103,000 and break through resistance at $105,000, a renewed push could retest the $106,000 ATH. Beyond this lies $107,000 and higher, where FOMO traders will flood in like kids at an all-you-can-eat candy buffet.
Bearish Scenario: A Break Below $103K Spells Trouble
If BTC loses its grip on $103,000, expect a drop toward $101,000 and even the critical $99,000 level. At that point, bears will be high-fiving, and Twitter will explode with “Is this the end?” memes.
Final Thoughts: The Calm Before the Breakout
Bitcoin’s ascending channel is a sign of steady bullish momentum, but this climb comes with caution. A break below the lower channel could shift the narrative, while reclaiming the ATH would open the doors to new heights. Will Bitcoin keep dancing in the channel, or will it burst through the ceiling for a moonshot? Grab your popcorn, refresh your charts, and get ready—this market has no chill! 🚀
- Dogecoin Price Analysis – January 14, 2025 - January 14, 2025
- Bitcoin (BTC) Price Analysis – January 13, 2025 - January 13, 2025
- Baby Doge Coin (BABYDOGE) Price Analysis – January 13, 2025 - January 13, 2025


