Table of Contents
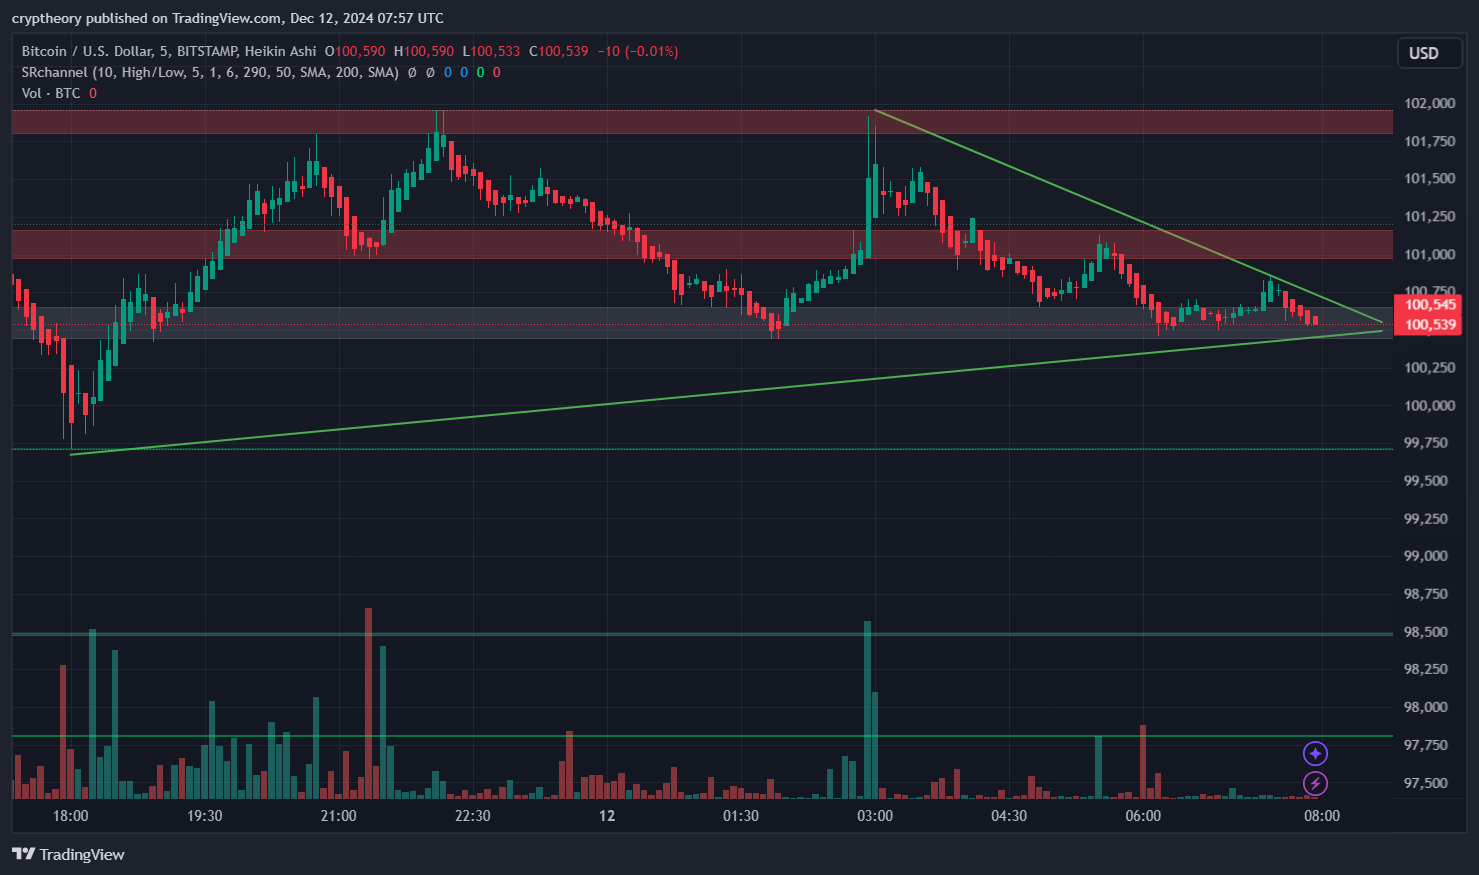
Ladies and gentlemen, Bitcoin enthusiasts, and chart-watching warriors, fasten your seatbelts because Bitcoin’s price action is playing out like a soap opera in the financial markets! The 5-minute chart is looking sharper than a ninja star, featuring a classic symmetrical triangle pattern—the battleground for bulls and bears to flex their muscles.

The Setup
Currently priced at $100,539, Bitcoin is moving cautiously as if it’s navigating through a minefield of resistance and support zones. The volume candles tell us there’s a fierce debate between buyers and sellers, but for now, the market seems undecided, sitting right at the apex of the triangle. Oh, Bitcoin, how dramatic you are!
Resistance Zones: The Roof Over the Bulls’ Party
- The first major resistance is at $101,000, a psychological level that’s making bulls break a sweat.
- If we zoom out (not too far, though, or the 5-minute chart will feel insulted), the $101,500 – $102,000 zone stands as the ultimate red wall that bulls need to demolish to unlock the door to glory.
Support Levels: The Lifeline for the Bears
- Support at $100,250 is where the bears have been taking a breather after an exhausting sell-off session.
- The $99,750 level below is acting as the safety net, but if this breaks, the bears might start singing their victory song all the way to $98,500.
Symmetrical Triangle: The Clash of Titans
Symmetrical triangles are like reality shows—predictable in their unpredictability. The market is coiling tighter than a spring, and a breakout is imminent. Bulls are hoping for a breakout to the upside, while bears are sharpening their claws for a breakdown to lower levels. The triangle’s lower trendline is rising, signaling that the bulls are still in the game, but the bears are guarding the upper trendline fiercely.
Volume Spike Drama
Did you see that volume spike around 03:00 UTC? Someone woke up and decided to shake the market! It seems like traders are gearing up for a decisive move, and they’re piling in their bets. If you listen closely, you might hear the whispers of whales getting ready to pounce.
What the Indicators Are Whispering
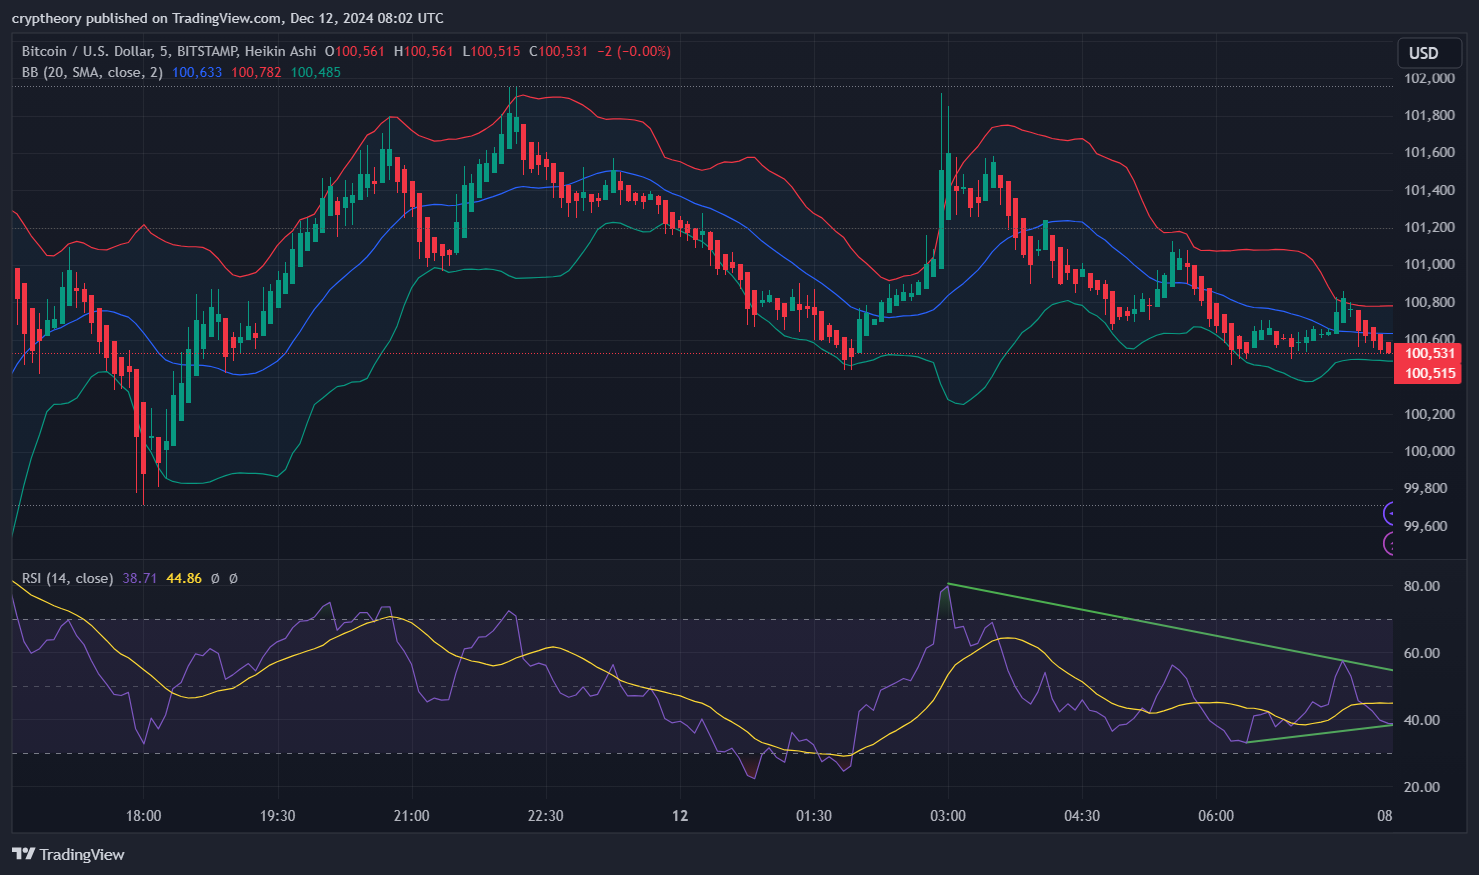
- RSI (Relative Strength Index): The RSI is hovering near neutral territory. Translation: Bitcoin is like a cat stuck on a fence, unsure whether to jump left (sell) or right (buy).
- Moving Averages: While the price is flirting with its short-term moving averages, the longer-term trend still seems cautiously bullish.

RSI (Relative Strength Index):
- RSI Value (14): The current value is 44.86.
- Trend: The RSI shows a slightly declining trend, indicating weaker buying pressure at the moment. There is also a divergence visible, where the price is forming higher highs, but the RSI is declining, signaling a potential correction.
RSI-based Moving Average:
- RSI Moving Average Value: The yellow line (RSI average) is at 38.71, confirming weaker momentum in the market.
- Interpretation: RSI is currently above its moving average, suggesting a short-term attempt by buyers to regain control.
Bollinger Bands:
- Middle Band (SMA 20): 100,782 USD (represents the average price over the last 20 candles).
- Upper Band: 101,600 USD.
- Lower Band: 100,485 USD.
- Band Width: The bands are relatively narrow, indicating low volatility and the likelihood of an imminent price movement (breakout or breakdown).
Summary:
- The RSI suggests weakening momentum but has not yet entered oversold territory (below 30).
- Bollinger Bands indicate market consolidation, hinting at a potential significant price move soon.
- Watch for a breakout above the upper band or a breakdown below the lower band and the RSI direction for further confirmation of the market’s next move.
Scenarios to Watch
Bullish Breakout: To the Moon (Well, Almost)
If Bitcoin manages to break above $101,000, it’s not just the bulls who will cheer; even your hodling cousin might call to brag about how they’re “winning” at crypto. The next targets could be $101,500, $102,000, and potentially $103,000, where a golden ticket to bullish paradise awaits.
Bearish Breakdown: To the Dungeon
On the flip side, if the bears win this tug-of-war and Bitcoin dips below $100,250, things could get slippery. Breaking $99,750 might trigger panic, sending Bitcoin down to test $98,500—a level where the market might collectively gasp.
Final Thoughts
Bitcoin is like that unpredictable friend who always keeps you guessing—will they throw a party or cancel plans last minute? Today’s symmetrical triangle is the perfect metaphor for Bitcoin’s indecision. Keep an eye on the volume and breakout levels because the market is about to reveal its hand.
Will the bulls ride the triangle breakout to new heights, or will the bears bring Bitcoin back to the trenches? Grab your popcorn, folks; this is going to be a nail-biter!
- Chainlink Price Analysis – January 9, 2025: The Struggle for $20 and Beyond! - January 9, 2025
- 📊 Kekius Maximus Price Analysis – January 7, 2025 🎭 - January 7, 2025
- 🚀 TON Price Prediction – January 6, 2025 📊🤖 - January 6, 2025


