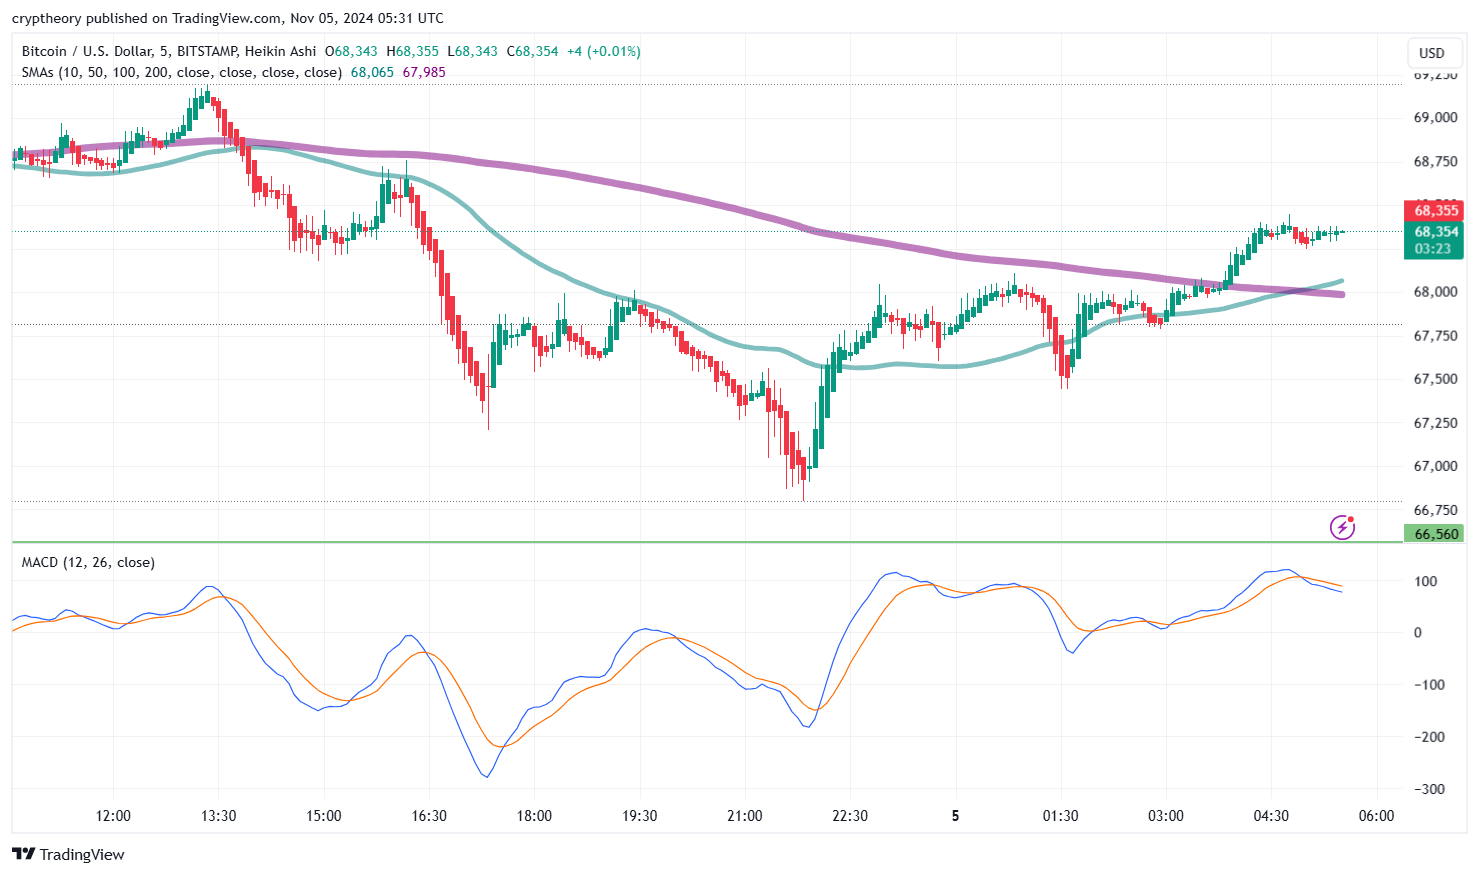
Alright, buckle up, folks. It’s November 5, 2024, and Bitcoin is back in the ring, throwing punches and dodging jabs like a prizefighter. We’re looking at a five-minute chart here, so things are moving fast, but that’s Bitcoin’s style—constantly in the spotlight, keeping traders on the edge of their seats (and sometimes on the edge of sanity).

Scene 1: The Battle of the Moving Averages
First, let’s talk about the Golden Cross—that famous moment when the 50-day moving average (our young hero) crosses above the 200-day moving average (the wise, seasoned mentor). It’s like a coming-of-age moment for Bitcoin, signaling, “I’m ready to rally!” Think of it like the underdog winning the big game, or that moment when your coffee finally kicks in on a Monday morning.
In this chart, we see Bitcoin flirting with this Golden Cross possibility. The shorter-term moving averages (10 and 50) are trying to cozy up to the 200-day SMA, which is holding strong like Gandalf shouting, “You shall not pass!” If they do manage to break above, though, we could be looking at a solid bullish signal. But remember—Bitcoin likes to play hard to get.
Scene 2: The MACD Love Story
Now, down in the MACD section, we’ve got another little soap opera unfolding. The MACD line and Signal line have been crossing and recrossing like they can’t decide if they’re on or off. We saw a nice bullish crossover recently, where the MACD line (blue) popped above the Signal line (orange), signaling that momentum was back on Bitcoin’s side. It’s like the market suddenly got a burst of confidence, going from “meh” to “I’m invincible!” in a matter of hours.
But here’s the catch: as with any relationship, these lines could fall out of love just as quickly. The last crossover looks promising, but keep an eye out—Bitcoin’s MACD love story has been known to take some dramatic twists.
The “Golden Cross” Tease
If Bitcoin manages to get that Golden Cross (where the 50-day SMA crosses above the 200-day SMA), it could be like a green light for the bulls to start their engines. Historically, a Golden Cross signals the potential for a sustained uptrend, with traders piling in like it’s Black Friday at a department store. But this is Bitcoin we’re talking about—it could easily flirt with the Golden Cross and then decide, “Nah, I’ll keep you guessing,” before dropping back down.
The Verdict: Is Bitcoin Ready for Liftoff?
So, what’s the takeaway here? Bitcoin is showing signs of life, teasing traders with hints of a rally. We’ve got some promising signals:
- Moving averages creeping closer to a potential Golden Cross.
- MACD signaling bullish momentum.
- Strong support levels ready to catch it if things get shaky.
But before you go all-in, remember: Bitcoin loves to keep things unpredictable. It could just as easily tease us with a Golden Cross, only to pull back like a bad date who cancels last minute. Until BTC breaks above that $68,355 resistance with conviction, there’s always a chance it’s just playing with our emotions.
Bitcoin’s RSI Soap Opera: The Saga of Support and Resistance”
Alright, folks, we’re back with another episode of Bitcoin and the RSI Chronicles. Our favorite volatile friend, Bitcoin, is dealing with some serious boundary issues. Let’s break it down!

The RSI and Its Mood Swings
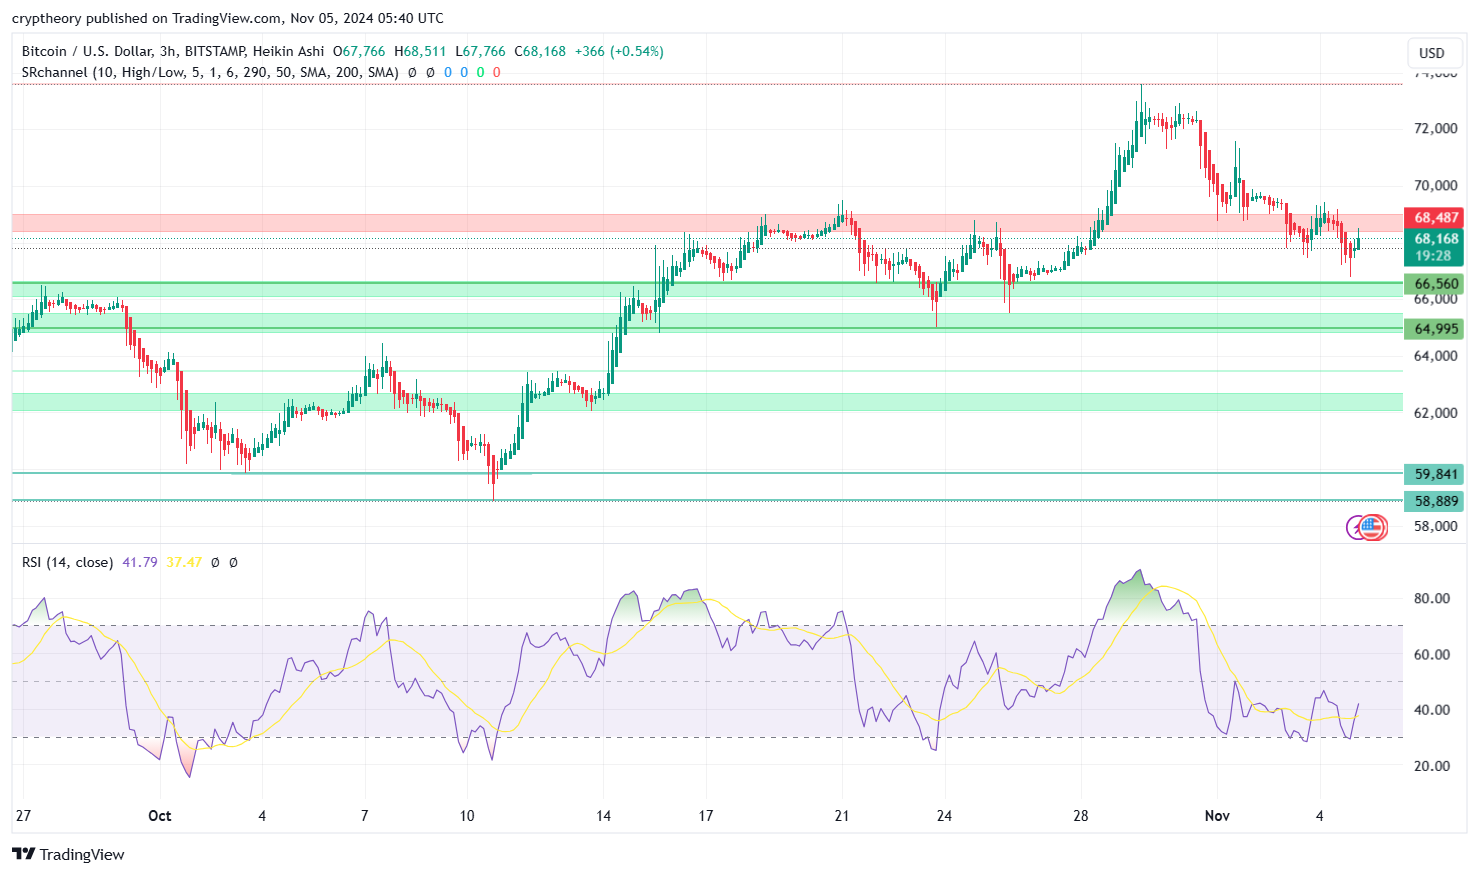
The Relative Strength Index (RSI) is giving us all kinds of signals. Right now, it’s hovering around 41.79, which is well below the 50-mark—a zone usually associated with a lack of enthusiasm. It’s like Bitcoin woke up this morning, glanced at the charts, and thought, “Eh, maybe I’ll just hit snooze.”
But wait! The RSI has been bouncing between oversold and not-quite-excited for a while now. It dipped under 30 in early October, hitting the “I’m too tired to even try” zone, but then perked up to around 70 later in the month, almost shouting, “I’m back, baby!”—only to lose steam again. At this point, the RSI is like that friend who can’t decide whether they want to stay home or go out. Right now, it seems to be leaning towards “home,” as it’s below the halfway line, just chilling in a state of low-key indifference.
RSI-Based SMA – The Supportive Sidekick
Now, the RSI-based SMA (Simple Moving Average) is here, and it’s acting like that reliable friend who always keeps it real. Sitting around 37.47, it’s telling RSI, “Look, maybe we’re not in the ‘party’ zone, but let’s just keep it steady.” The RSI itself seems to be bouncing above and below this SMA, like a cat deciding whether or not it actually wants to sit in that box.
With RSI staying so close to its SMA, it’s like Bitcoin is cautiously testing the waters, trying to figure out if it’s worth making a move. For now, though, RSI and its SMA are just doing the limbo, keeping the vibe mellow without any big dramatic surges.
The Fortress of Supports and the Wall of Resistances
Now, let’s talk about the real estate on this chart—the support and resistance levels.
- Supports are lined up around 66,560 and 64,995 like a group of loyal friends ready to catch Bitcoin if it stumbles. These levels are painted in green like a lush safety net, signaling, “We’re here if you need us!” They’re ready to provide a soft landing, almost like a therapist reassuring Bitcoin, “It’s okay if you fall, we’ll be right here.”
- On the other hand, the resistance levels are looking a little intimidating around 68,487. It’s as if these red zones are saying, “Not so fast, buddy.” Every time Bitcoin tries to climb up, this resistance is there, crossing its arms and refusing entry like a strict bouncer at an exclusive club. Bitcoin might knock, but without the right momentum (which RSI clearly lacks at the moment), it’s going to have a hard time getting past these gates.
The Verdict: A Waiting Game
So, where does this leave us? Bitcoin’s RSI is low, the SMA is giving it a nudge to stay steady, and the supports are all lined up to catch it if things get rocky. Meanwhile, resistance is blocking any quick path to glory. It’s like Bitcoin is standing outside the door to a party, trying to muster the energy to go in, while support keeps patting it on the back and saying, “It’s okay, take your time.”
In summary, Bitcoin is stuck in a state of mild indecision. Until the RSI gains some momentum or Bitcoin breaks through these resistance levels, it looks like we’re in for a waiting game. So grab some popcorn, because this might take a while, and enjoy the show as Bitcoin’s RSI decides whether it’s ready to wake up from its nap or just keep snoozing!
In summary, Bitcoin’s price action is like a rom-com where the hero might get the happy ending—but there’s still one last plot twist waiting to happen. Keep your stop-losses tight, your patience strong, and enjoy the show as Bitcoin decides whether it’s finally ready to embrace the Golden Cross or just keep us on the edge of our seats!
- Michaël van de Poppe: Bitcoin to Hit $500,000 This Cycle? 🚀💸 Or Just Another Crypto Fairy Tale? - December 21, 2024
- What is the Meme Coin Bonk, Price Predictions 2025–2030, and Why Invest in BONK? - December 18, 2024
- BNB Price Analysis: 17/12/2024 – To the Moon or Stuck on a Layover? - December 17, 2024


