Table of Contents
Ladies and gentlemen, welcome to the wild world of Bonk, where meme-fueled chaos meets technical analysis, and we all wonder whether this lovable dog-themed coin is about to fetch the moon—or just its tail. Let’s dig into this chart and unravel what Bonk has in store for us today.

Trend Analysis: Bonk’s Tail Wagging the Dog
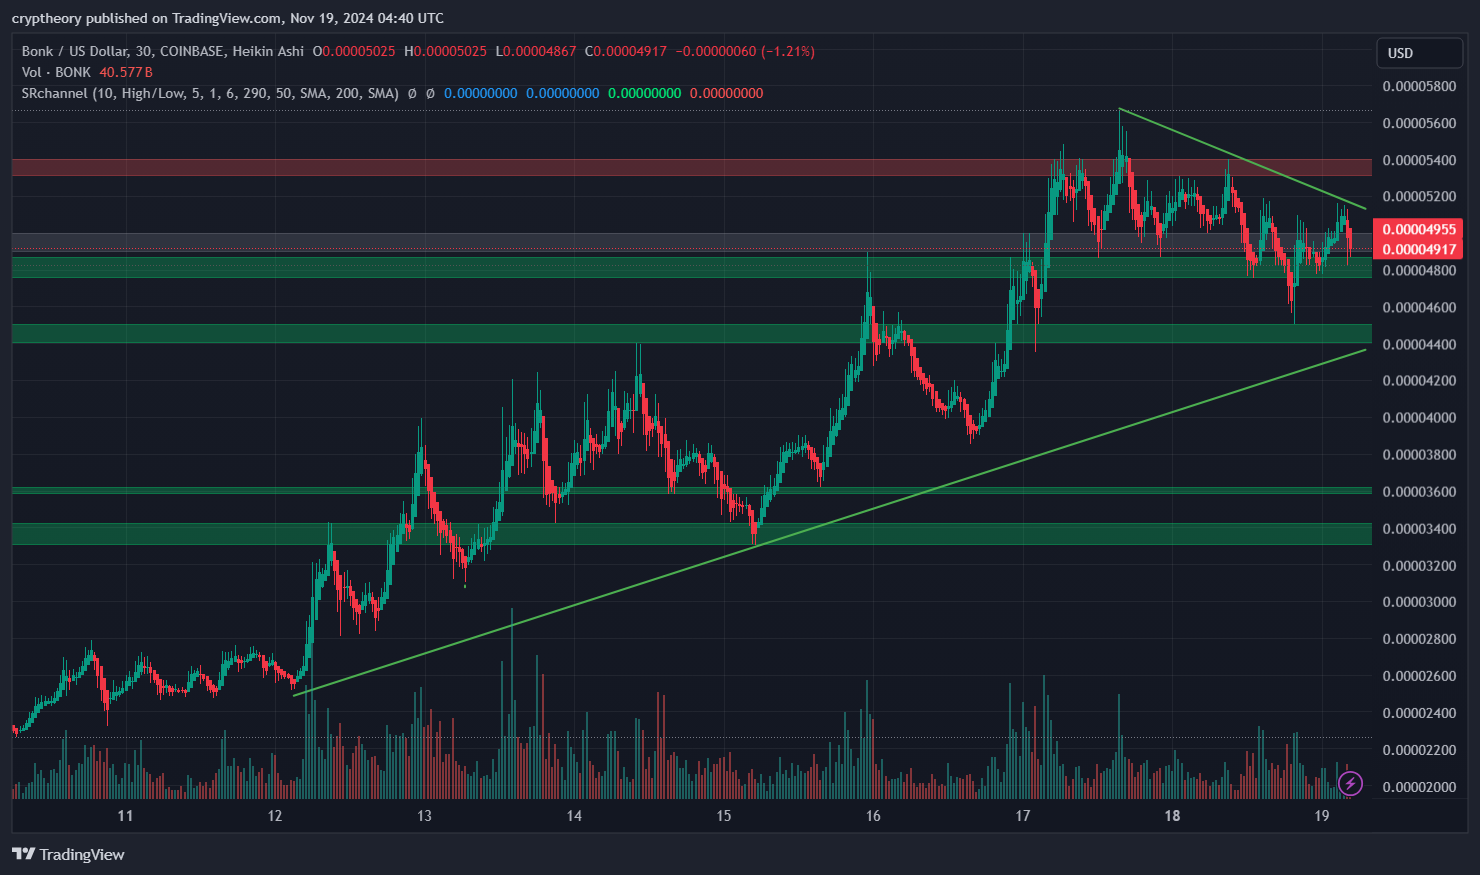
The Bonk chart is a masterpiece of indecision, with price action ricocheting like a hyperactive pup chasing squirrels. Over the past few days, Bonk has been climbing an impressive upward trendline—a true underdog story—but now it’s butting its head against a descending resistance line. It’s like watching a dog try to jump a fence that’s just a little too high.
Support and Resistance: Where’s the Bone?
- Key Support Levels:
- $0.00004800: Bonk’s cozy kennel, providing a sturdy base for every correction. It’s the line in the sand where buyers seem to yell, “Good boy!” and pile in.
- $0.00004400: A lower safety net, where Bonk might retreat if the bulls go walkies.
- Resistance Levels:
- $0.00005200: The local nemesis, this level has been rejecting Bonk like a cat guarding the sofa.
- $0.00005400: The ultimate ceiling for now, where sellers seem to hang out and laugh at Bonk’s attempts to break free.
Volume: Bark Louder, Bonk
The volume is starting to fade, much like a tired dog after a long day at the park. It suggests traders are on edge, waiting for Bonk to make its next move. The question is, will Bonk bark loud enough to scare off the bears, or will it whimper and head back to lower support levels?
Price Action: The Tense Tug-of-War
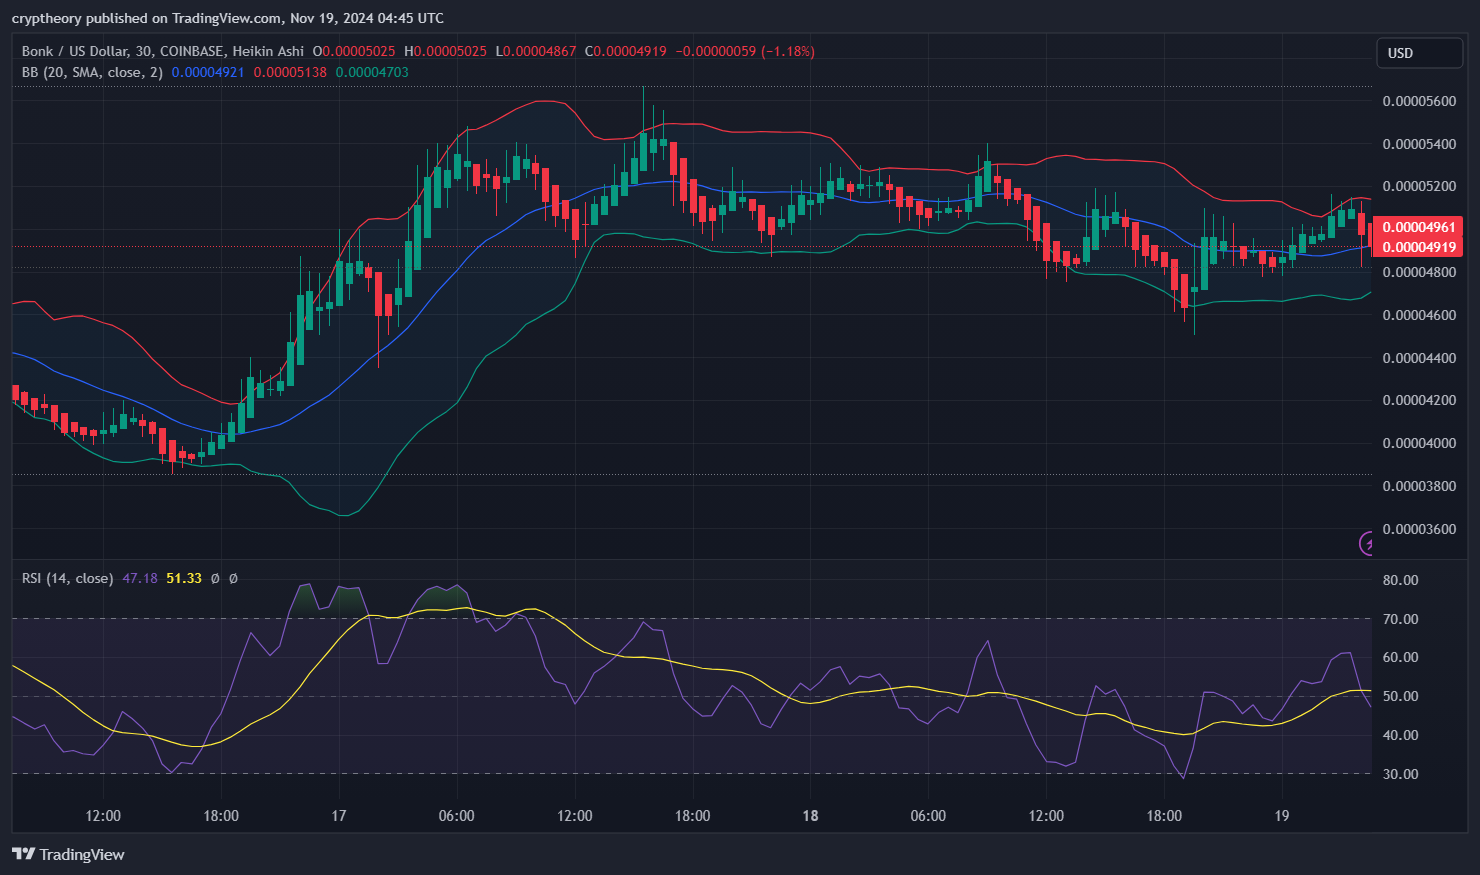
Bonk is currently playing in a narrowing triangle—traders are like dog owners pulling opposite ends of a leash. The ascending trendline is nudging Bonk higher, but the descending resistance is keeping it from running wild. A breakout is inevitable, and when it happens, Bonk might either chase a stick into orbit or tumble into the neighbor’s yard.

Observations: Bonkonomics
Bonk doesn’t care about fundamentals—it’s all about the vibes, memes, and community enthusiasm. A single tweet about this coin, and the chart could turn into something resembling a firework display. But for now, the technicals suggest a moment of suspense, like waiting to see if your dog’s about to knock over a glass of water.
Indicators: A Dog’s Compass
- Trendline Support: The rising trendline is keeping Bonk on a leash, pushing it to higher lows. Good doggo behavior.
- Descending Resistance: The “bad cop” of this story, stopping Bonk from escaping to higher highs. Naughty, naughty.
- Key Zones: Bonk has clearly defined areas of battle—support at $0.00004800 and resistance at $0.00005200. Break either one, and we’re in for some fireworks.
Final Thoughts and Strategy
Bonk is in the middle of its own suspense thriller. The triangle squeeze suggests a breakout is imminent. If Bonk manages to clear $0.00005200, we could be looking at a moon mission toward $0.00005600 or beyond. However, if it loses the $0.00004800 level, the bears might drag it down to the lower support of $0.00004400.
Trading Idea
- For the Bulls: Long above $0.00005200, targeting $0.00005600, with a stop loss at $0.00005000.
- For the Bears: Short below $0.00004800, targeting $0.00004400, with a stop loss at $0.00004900.
In the meantime, keep your eyes on the triangle and prepare for Bonk to show whether it’s the “goodest boy” or just another meme coin barking up the wrong tree. Happy trading, and may your Bonk bags bark with joy! 🐕📈
- Solana Price Analysis – December 18, 2024: The Slippery Slope of SOL 🚀📉 - December 18, 2024
- Bitcoin Price Analysis – 16/12/2024: A Dance in the Ascending Channel - December 16, 2024
- What is Monero, Price Predictions for 2025–2030, and Why Invest in XMR? - December 16, 2024


![Best Platforms for Copy Trading in [current_date format=Y] 26 Best Platforms for Copy Trading](https://cryptheory.org/wp-content/uploads/2024/12/copy-trading-120x86.jpg)


