Table of Contents
It’s November 7, 2024, and Bitcoin is throwing a party—or at least it’s trying to. The chart looks like a perfect metaphor for today’s political landscape: chaotic, unpredictable, and full of resistance. With Donald Trump emerging victorious in the 2024 U.S. presidential election, markets are buzzing, and Bitcoin seems to be caught between shouting “Make Crypto Great Again” and nervously eyeing resistance levels. Let’s break it down with a side of humor.
Support Zones: Bitcoin’s Safety Nets
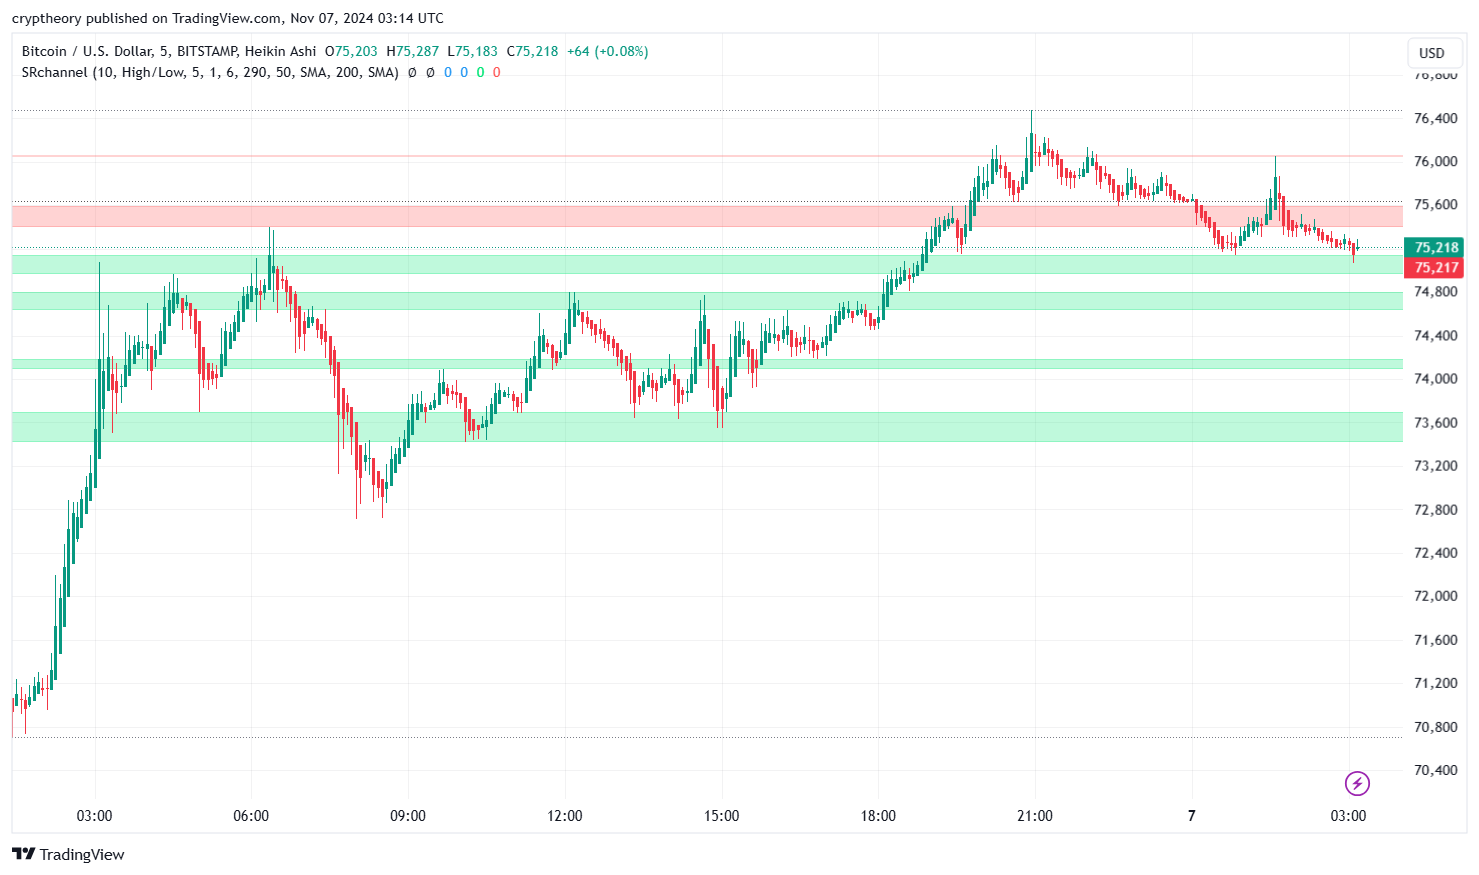
Bitcoin has built a lovely little home in the $74,800 – $75,000 range. This green support zone is like a comfy couch for BTC, catching it whenever it trips. Below that, there’s an even cushier layer around $73,600, acting as a backup safety net for those really bearish moments.
Think of these zones as Bitcoin’s therapists, whispering, “It’s okay to fall… as long as you get back up.” And so far, BTC seems to agree, bouncing back repeatedly like a stubborn boxer refusing to stay down.
Resistance Levels: The Trump Wall of Crypto
Here’s where things get spicy. The $75,600 – $76,000 zone is acting like Trump’s famous (and literal) wall—keeping Bitcoin locked out of the upper echelons of price glory. Every time BTC tries to climb, this resistance laughs and says, “Not today, buddy.” And let’s be honest, Bitcoin’s struggles here are eerily reminiscent of a political campaign trying to breach swing states—it’s a tough fight.
Above that, $76,400 is like the boss level. If BTC manages to break this, we could be looking at a full-fledged rally. But for now, Bitcoin looks like it’s doing push-ups, gathering strength for its next attempt.
Price Action: Slow but Steady
Bitcoin has been on a slow upward grind, hitting highs of $76,000-ish before retreating to its current levels around $75,218. It’s the equivalent of someone cautiously stepping on a creaky staircase, worried it might collapse—but still moving up. The trend is positive, but BTC needs a real catalyst to break through resistance zones.
Donald Trump’s Election Victory: The Elephant in the Room
Trump’s win has added a touch of volatility to global markets, and crypto is no exception. On one hand, the prospect of deregulation has the crypto bulls giddy—imagine Bitcoin trading tax-free with the slogan “Drain the Blockchain Swamp!” On the other hand, uncertainty about U.S.-China relations and the economy has some traders biting their nails, sending mixed signals into the crypto sphere.
But if there’s one thing we’ve learned about Bitcoin, it thrives on chaos. Trump’s win could serve as the spark BTC needs to blast through resistance, but for now, it’s all speculation and sideways action.
The Verdict
- Bullish Scenario: If BTC can break above $76,000 and hold, we might see a new rally fueled by optimism and market momentum. The next stop would be $76,400, and beyond that, who knows? Maybe $80K is calling.
- Bearish Scenario: If Bitcoin stumbles below $74,800, it could test support at $73,600, and any break below that might trigger panic-selling.
In short, Bitcoin is like a politician on the campaign trail—facing resistance, bouncing back, and trying to win the hearts (and wallets) of traders. Whether Trump’s presidency becomes a crypto blessing or a Bitcoin-sized headache remains to be seen. For now, Bitcoin is gearing up for its next big move, and we’re all just along for the ride.
Let’s hope it’s more “rally to the moon” and less “stuck in consolidation purgatory.”
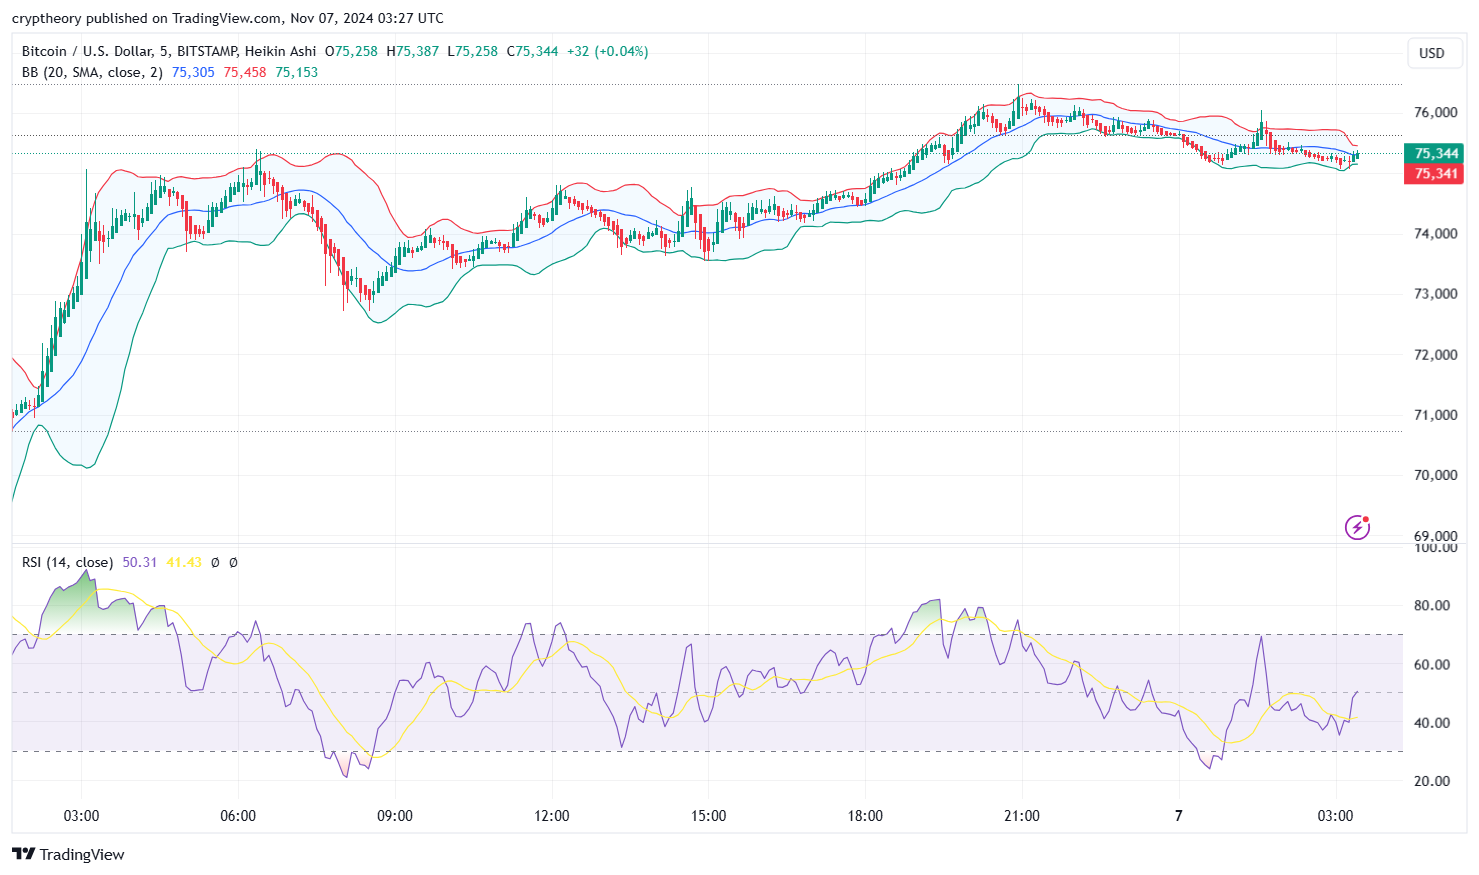
Detailed Analysis of RSI, RSI-Based MA, and Bollinger Bands (07/11/2024)
Let’s dive into the indicators that give us an inside look at Bitcoin’s current vibe. Here’s what the RSI, RSI-based moving average, and Bollinger Bands tell us about the market:

Relative Strength Index (RSI)
- Current Value: 50.31
RSI is sitting right on the neutral 50-mark, which is like Bitcoin saying, “I’m not particularly excited or upset—just chilling for now.” - Recent Movements:
Earlier in the chart, RSI dipped below 30, hitting the oversold zone and signaling exhaustion among sellers. It then climbed back above 70, showing Bitcoin’s attempts to regain momentum and enter the overbought zone. However, it’s now retreated to the neutral zone, reflecting indecisiveness. - Interpretation:
Bitcoin is at a crossroads—neither strongly bullish nor bearish. The RSI is keeping a poker face, waiting for the market to pick a direction.
RSI-Based Moving Average
- Current Value: 41.43
The RSI-based moving average is trailing behind the RSI itself, highlighting the lag in momentum. It’s acting like a “steady Eddy,” smoothing out Bitcoin’s short-term mood swings. - Dynamic Relationship:
The RSI frequently crosses above and below its moving average, signaling short-term changes in momentum. These mini crossovers suggest Bitcoin is hesitant, unsure of whether to keep climbing or pull back. - Key Takeaway:
Watch for RSI to decisively cross above its MA and stay there—this could indicate renewed bullish momentum.
Bollinger Bands
- Upper Band: $75,458
- Middle Band (SMA): $75,305
- Lower Band: $75,153
The Bollinger Bands are tightening, indicating a squeeze. This suggests volatility is low right now, but a breakout could be looming. Whether Bitcoin bursts upward or crashes downward is anyone’s guess—but the squeeze is often a precursor to big moves.
- Price Behavior:
Bitcoin is currently hovering near the middle band, showing consolidation within the Bollinger Bands. Prices briefly touched the upper band during the earlier rally but didn’t maintain momentum, retreating toward the middle. - Interpretation:
This sideways action suggests the market is gathering energy, with traders waiting for a clear signal to decide the next move. If Bitcoin breaks above the upper band, it could signal the start of a bullish trend; breaking below the lower band would suggest the opposite.
Summary of Indicators
- RSI: Neutral, no strong momentum either way, signaling hesitation.
- RSI-Based MA: Slightly bearish in tone but not definitive—BTC could shift gears quickly.
- Bollinger Bands: Low volatility with a squeeze forming, setting the stage for a significant breakout.
Final Takeaway
Bitcoin is like a sprinter at the starting line, stretching and preparing for a big move. The RSI is neutral but with potential, the Bollinger Bands are hinting at an upcoming explosion, and the RSI-based MA is keeping things grounded. Keep an eye out for breakouts above $76,000 or dips below $74,800, as these could signal the direction of the next major trend!
- What Could Bitcoin’s Price Be in 25 Years? A Lambo or Just a Latte?” 🚀💸 - December 23, 2024
- Solana Price Analysis – December 18, 2024: The Slippery Slope of SOL 🚀📉 - December 18, 2024
- Bitcoin Price Analysis – 16/12/2024: A Dance in the Ascending Channel - December 16, 2024


