Table of Contents
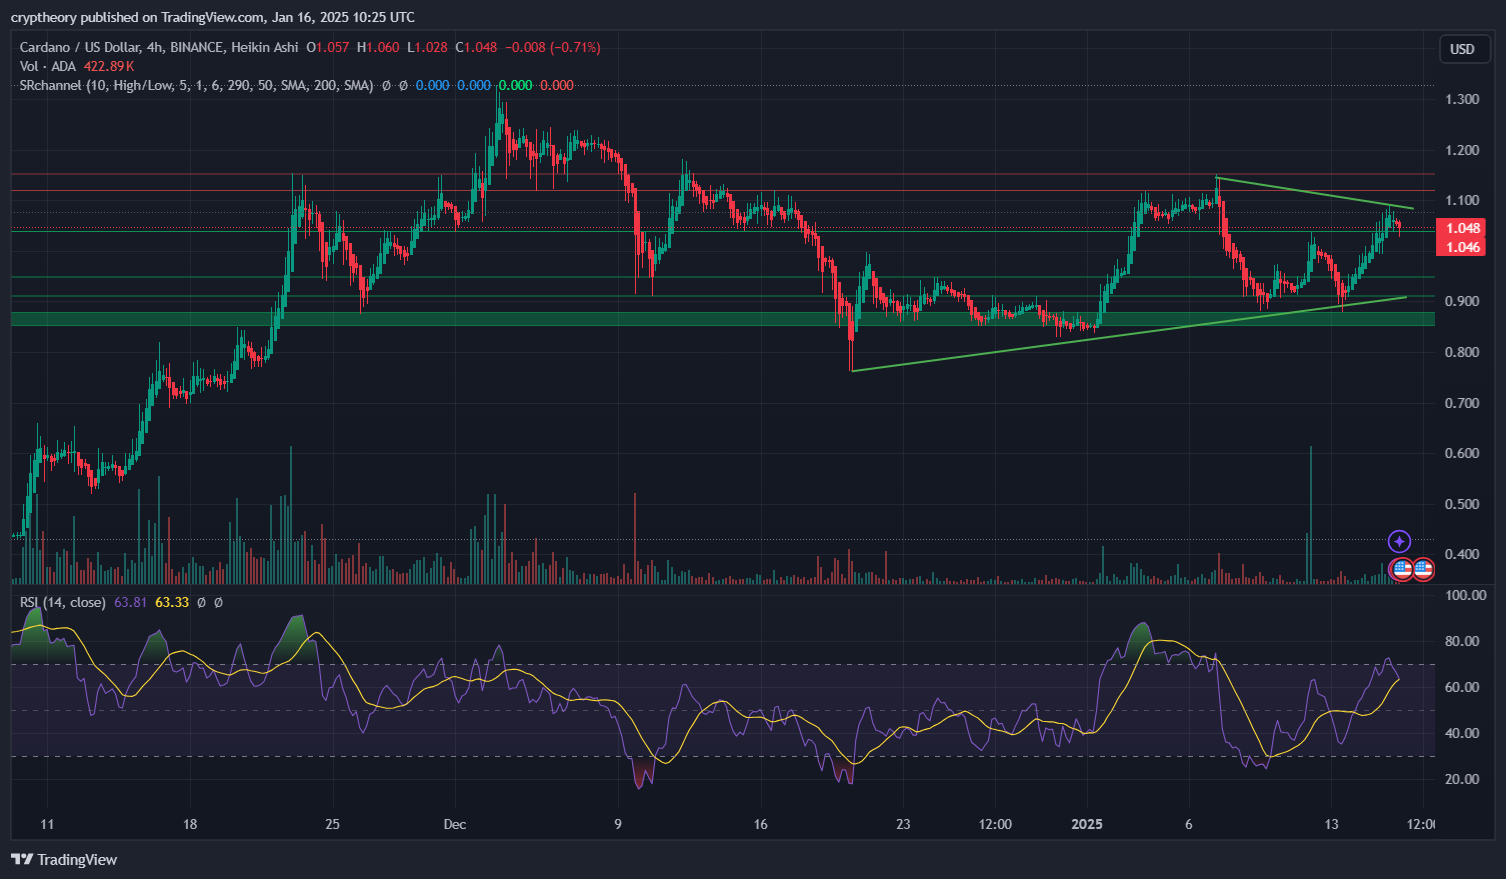
Cardano (ADA) is showing an interesting price structure, currently trading near key resistance levels within an ascending wedge pattern. This pattern typically signals a potential breakout or breakdown depending on market conditions. Let’s break down the technical outlook, key levels, and potential price scenarios.

Trend Analysis
- Ascending Support Trendline: Cardano is respecting an upward trendline, bouncing off support levels multiple times.
- Descending Resistance Line: The price has formed lower highs, indicating possible resistance around the $1.10 – $1.15 zone.
- Converging Structure: ADA is moving within an ascending wedge, which is a potentially bearish pattern but could still lead to an upside breakout.
Key Support & Resistance Levels
- Resistance Levels:
- $1.10 – $1.15 → Major resistance zone where the price has been rejected previously.
- $1.20 – $1.25 → Next resistance zone in case of a bullish breakout.
- $1.30+ → Long-term bullish target.
- Support Levels:
- $1.00 → Psychological and technical support.
- $0.90 – $0.92 → Stronger support zone, previously tested as a bounce area.
- $0.80 → Deeper support, critical for bullish structure integrity.
Indicators Overview
- Relative Strength Index (RSI 14, Close):
- Current RSI: 63.81 (approaching overbought but not extreme).
- RSI suggests momentum is bullish but nearing a resistance area.
- Volume Analysis:
- Volume spikes during price pullbacks indicate buying interest.
- However, volume decreases at higher levels, suggesting possible weakening momentum.
Cardano Short-Therm Analysis
This chart represents Cardano’s (ADA/USD) short-term price action on the 1-minute timeframe.

📌 Moving Averages Overview (SMA 50, 100, 200)
- SMA 50 (Short-term): 1.038 – The price is currently above this level, signaling short-term bullish momentum.
- SMA 100 (Medium-term): Not explicitly shown but assumed to be slightly above the SMA 50.
- SMA 200 (Long-term): 1.048 – Acting as resistance, with price testing this level.
🔎 Key Observation:
- The price is trading between the SMA 50 and SMA 200, meaning a breakout above the 200-SMA could confirm further bullish movement.
- If price rejects the SMA 200, it could signal a short-term pullback.
📌 Accumulation/Distribution (Accum/Dist) Indicator
- Current Level: 6.28M
- Trend: Recently declining, indicating distribution (selling pressure) was dominant.
- Latest Movement: Stabilizing, suggesting that buying interest is slowly returning.
🔎 Key Observation:
- The downward slope of the Accum/Dist line earlier in the session confirms selling pressure during the downtrend.
- The flattening and slight increase in Accum/Dist recently suggests accumulation, aligning with the price recovery seen in the chart.
📈 Market Trend & Trade Evaluation
- Recent Trend: Downtrend followed by a recovery.
- Current Resistance: SMA 200 ($1.048).
- Current Support: SMA 50 ($1.038).
- Accumulation Strength: Weak but showing early signs of recovery.
Potential Scenarios & Price Prediction
🚀 Bullish Scenario: Breakout Above $1.10
- If Cardano breaks above the $1.10 resistance, it could gain momentum and push toward $1.15 – $1.20.
- RSI would likely move into overbought territory, but a strong breakout with volume could support an extended rally.
- Target Levels:
- Short-term: $1.15
- Mid-term: $1.20
- Long-term: $1.30+
Trigger for entry: A 4-hour candle closing above $1.10 with increased volume.
📉 Bearish Scenario: Rejection at $1.10 and Breakdown
- If ADA fails to break above $1.10, sellers could take control, leading to a pullback toward support at $1.00 – $0.92.
- The ascending wedge pattern is typically bearish, meaning a breakdown is possible.
- Confirmation: If price closes below $1.00, further downside is likely.
Key support zones to watch:
- $1.00 (Psychological level)
- $0.92 – $0.90 (Strong support zone)
- $0.80 (Critical support, last line for bullish trend continuation)
Trigger for short trade: Breakdown below $1.00 with volume confirmation.
Final Prediction & Trading Strategy
Short-Term (1-2 Weeks)
- ADA is at a decision point. If it breaks $1.10, it could rally to $1.20.
- However, if resistance holds and price drops below $1.00, expect a move toward $0.90 – $0.92.
Mid-Term (1-2 Months)
- If $1.00 support holds, ADA could consolidate before a potential bullish breakout toward $1.20 – $1.30.
- Failure to hold $0.90 support could lead to a deeper correction.
Long-Term Outlook
- ADA remains in a macro uptrend, but a short-term correction is possible before a larger bullish move.
- A successful breakout above $1.20 would confirm long-term bullish momentum toward $1.50+.
Trading Strategies
📈 Bullish Trade Setup (Long)
- Entry: Above $1.10 breakout.
- Targets: $1.15 → $1.20 → $1.30
- Stop-Loss: $1.00
- Risk/Reward: 2:1 or higher.
📉 Bearish Trade Setup (Short)
- Entry: Below $1.00
- Targets: $0.92 → $0.90 → $0.80
- Stop-Loss: $1.05
- Risk/Reward: 2:1 or higher.
🚀 Conclusion: ADA at a Pivotal Point
Cardano is at a key resistance level within an ascending wedge pattern. The $1.10 zone will determine its next big move. A breakout could lead to $1.20+, while rejection could push it back toward $0.90 – $1.00.
📌 Keep an eye on volume and RSI for confirmation! 📊🔥
- Why Online Advertisers Should Request Website Traffic Data from Google Analytics Instead of Using SEO Tools Like MOZ or Ahrefs? - March 24, 2025
- North Carolina’s Bold Move: State Bill Proposes Investing 10% of Public Funds in Bitcoin - March 22, 2025
- Justin Sun Stakes $100 Million in Ethereum on Lido – What Does It Mean for the Market? - March 19, 2025


