With Ethereum 2.0 on the works, the debate about where this cryptocurrency is headed next has intensified. Some of the most prominent analysts in the industry argue that it could serve as the catalyst for a new bull run. Meanwhile, there are others who maintain that a major correction is underway.

A renowned chartist under the pseudonym TraderXO, for instance, recently anticipated that Ethereum was bound for an upswing before continuing its march towards $142. Now that the smart contracts giant has indeed surged more than 17% from Monday’s swing low, it could be gearing up for a massive bearish impulse.
Given the unpredictability of the crypto market, every scenario must be taken with a grain of salt. Nevertheless, fundamental metrics suggest that such a pessimistic outlook may actually come true.
Ethereum Twitter Follow Count as a Price Forshadower
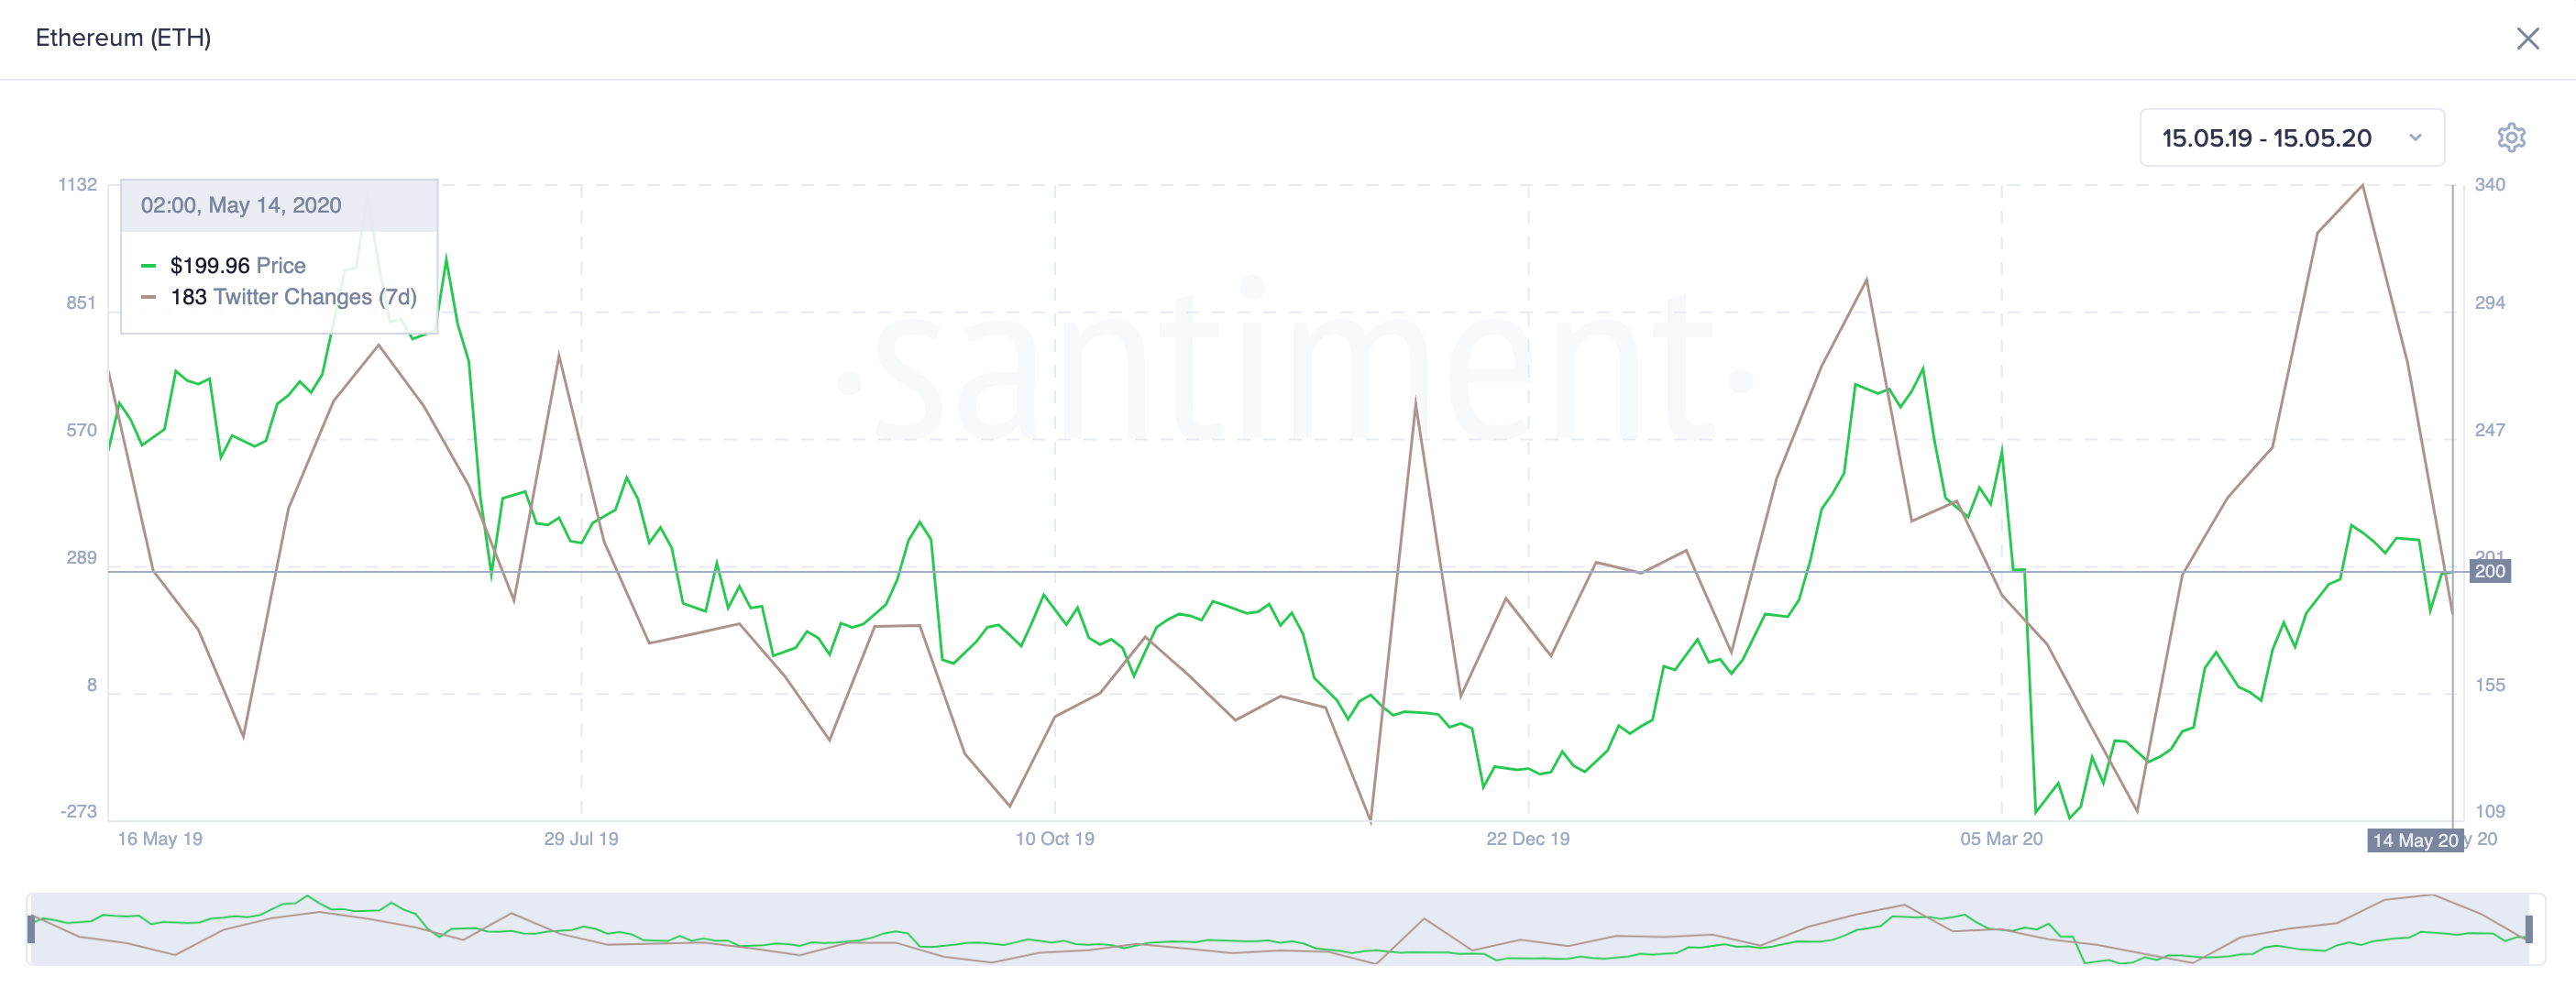
The changes in the number of followers on Ethereum’s official Twitter account appears to be highly correlated with the price action of this altcoin. As a matter of fact, each time Ether’s Twitter followers’ count goes down, its price tends to follow.
This odd correlation has been developing for more than a year, which adds credence to its predictive powers over the price of ETH. And, Santiment’s Twitter changes index helps visualize this trend.
Following Ether’s peak of $363 in late June 2019, for instance, the 7-day average of the number of Twitter followers that Ethereum had entered a downward momentum. By the time this indicator was down more than 40%, the selling pressure behind ETH accelerated pushing it down towards $191.
A similar phenomenon occurred in mid-February of the present year. As Ethereum reached a yearly high of $287, the 7-day Twitter changes average began dropping from a value of 933 to 390. One day later, ETH dropped by 27%. Then, Santiment’s metric took another massive nosedive, which was followed by the infamous March market meltdown.

Now, this fundamental gauge seems to have topped on April 30 going from a high of 1132 to recently hitting a low of 183. The significant down movement took place as Ethereum was peaking at a high of $227.
Since then, the smart contracts giant is down by more than 12 percent. However, the degree of the slope in which the 7-day Twitter changes average went down suggests that ETH may be bound for a steeper decline.
Strong Support Ahead
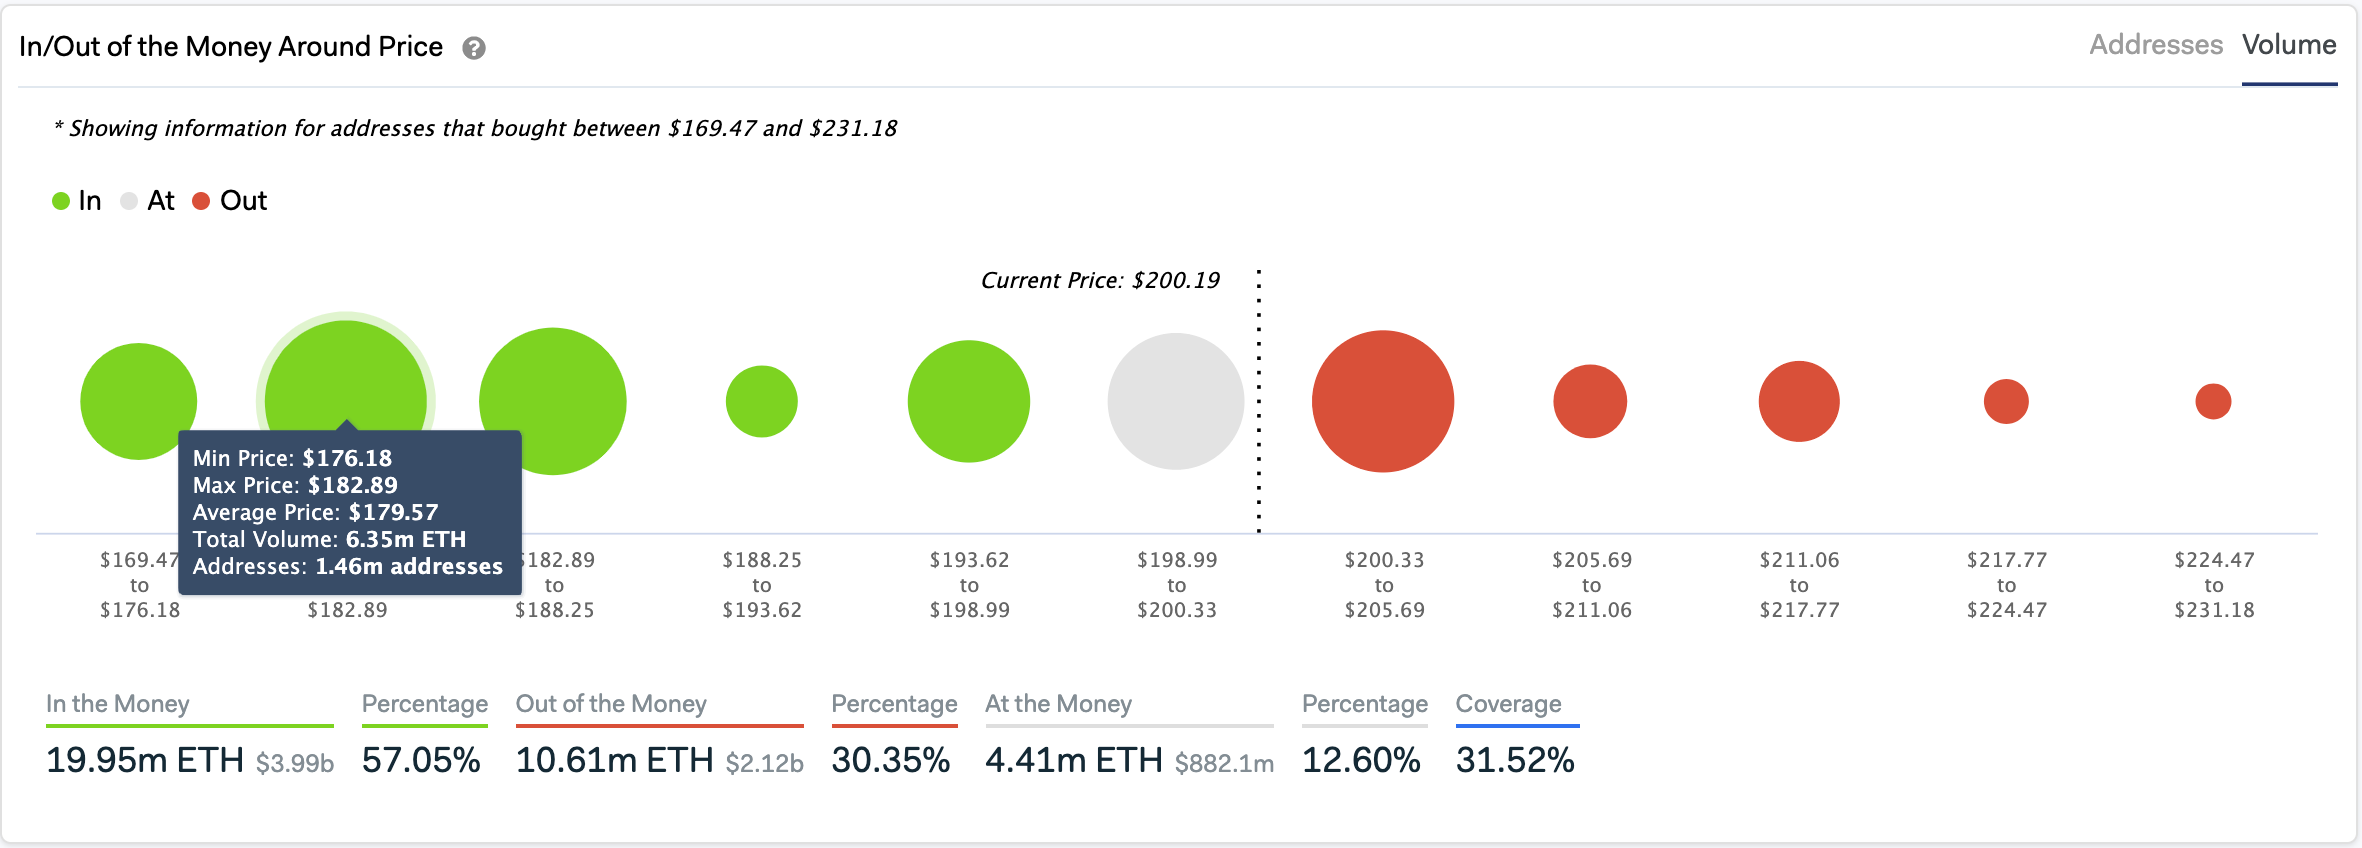
A spike in sell orders might be able to push the price of Ethereum down as the aforementioned index implies. IntoTheBlock’s “In/Out of the Money Around Price” (IOMAP) model reveals that on its way down Ether could find strong support around $180.
Here, nearly 1.5 million addresses bought 6.35 million ETH. Such an important supply barrier may have the ability to contain the smart contracts giant from a further decline. But if it fails to do so, the IOMAP shows that the next area of support sits around $158.

Only time will tell whether or not Santiment’s 7-day Twitter changes average proves to be right once again. If it does, it is very likely that sidelined investors will take advantage of this opportunity to get back into the market. A new inflow of fresh capital may have the ability to ignite the bull cycle that everyone has been talking about.
You shoul be interested in: How much you might earn staking on Ethereum 2.0
- A Look Back at Bitcoin’s Historic Year 2024: From ETFs to New All-Time Highs - December 31, 2024
- Ethereum Price Could Skyrocket in 2025: Here’s What Experts Expect 🚀📊 - December 31, 2024
- How Trump’s Politics Could Send Ethereum to the Moon—Or Just to Mar-a-Lago? - December 30, 2024


