We will look at some graphs that illustrate the basic dynamics of BTC, spot and futures markets. We will find out how two key indicators for each of these markets correlate with price: the funding rate of perpetual futures and the change in the net position of long-term holders.
What do funding rate and the change in the net position of long-term holders tells us
We mention the perpetual futures funding rate very often. This is a key rate that the futures market must pay attention to, especially when there is a high market imbalance towards buying or selling, as the derivatives market can have a significant impact on short-term BTC price movements.
In the two charts below, the perpetual futures funding rate is color-coded in BTC’s price chart to highlight the period of negative funding rate values.
Dark blue areas indicate periods of high leverage on the purchase side, while red areas indicate periods of high leverage on the sales side. Each of these periods is followed by an explosive price movement in the opposite direction.
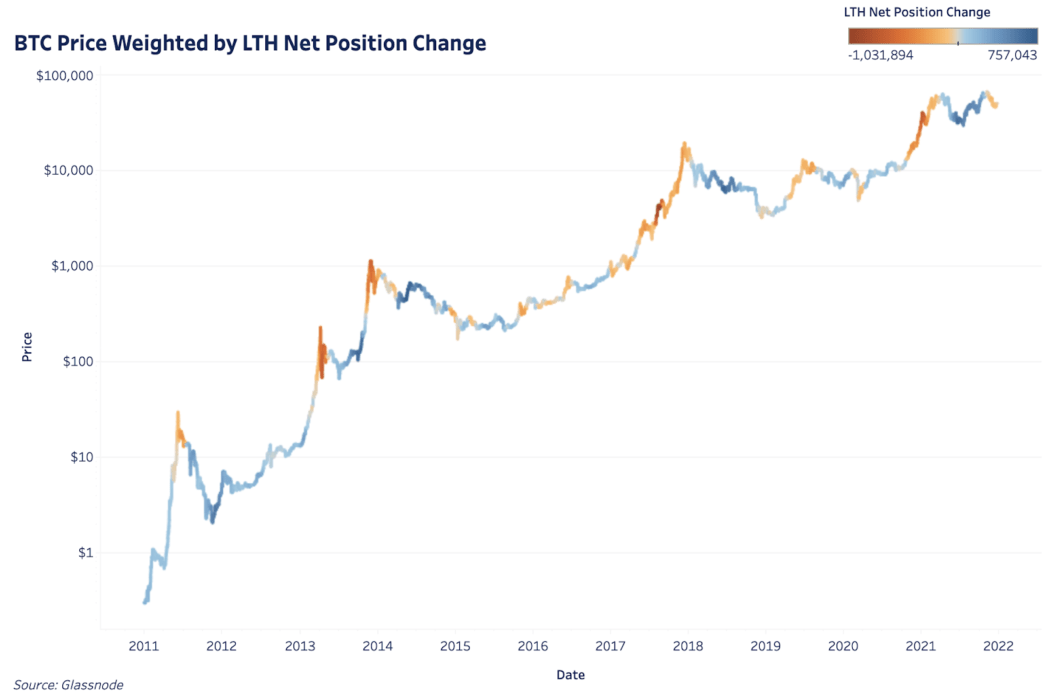
The derivatives market affects the price in the short term, but in the long term the price is determined by the adoption rate, immediate demand and behavior of long-term holders. One way to visualize this dynamic is to change the net position of long-term holders; The metric monitors a 30-day change in the volume of the offer managed by long-term holders.
As has been mentioned many times, each BTC record price is accompanied by a significant distribution of “coins” from long-term holders to new entrants. The periods of this distribution are shown in dark red in the graphs below, while the periods of relatively intense accumulation are indicated in dark blue.
Approaching and correlating with the funding rate for perpetual futures in the same time frame, it can be seen that long-term owners distributed their holdings intensively just before the funding rate in the derivatives market peaked in April 2021. When the inflow of new spot purchases was exhausted, the price remained with support other than the futures market.
During July, when negative futures rates signaled high open interest from sales, long-term holders actively accumulated coins, providing strong price support. This accumulation continued until November, reversed the trend and is now in a neutral state.
This type of analysis can give us an idea of when the derivatives market has a strong price impact in the short term and may not be sustainable. It also reflects a period of extreme changes in the net position of long-term holders, which determines the price of BTC in the long run.
Both of these indicators are currently in a neutral state, indicating continued consolidation.
ProShares registers Metaverse ETF


