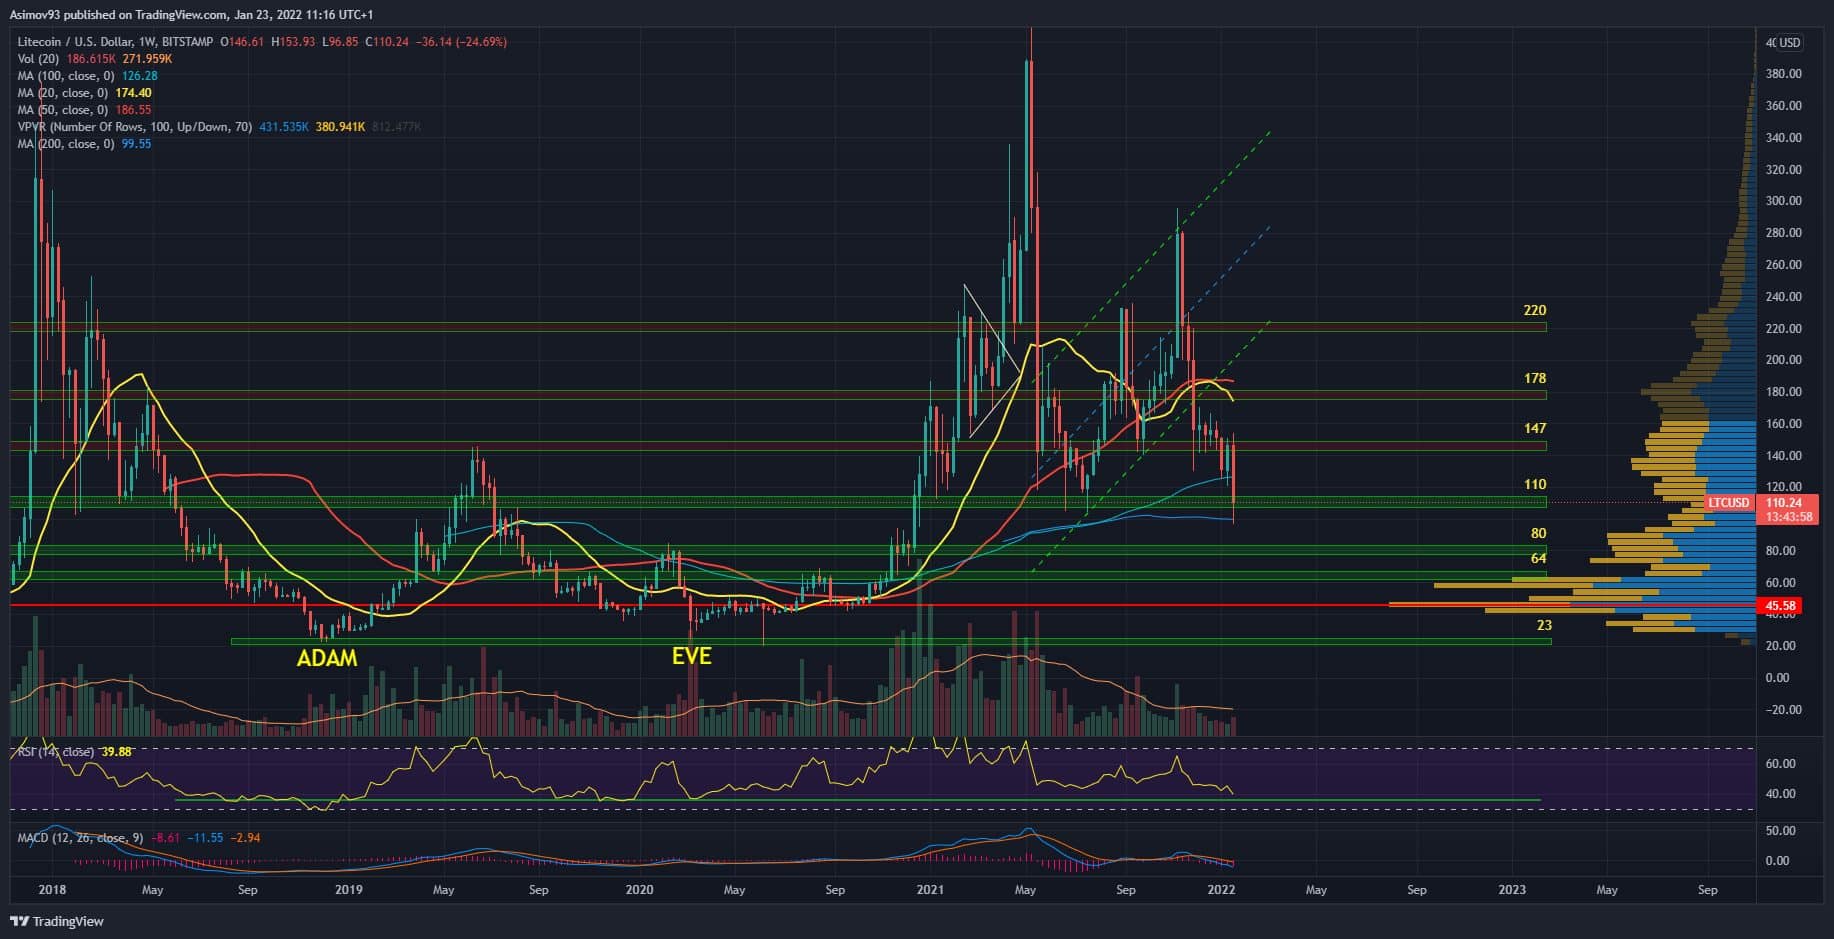
Litecoin (LTC) has created a new bottom since last year’s all-time high, which even hit the $ 100 mark. Therefore, it is appropriate to look at the market from a much larger perspective, for which the weekly chart is ideal.
Current situation at 1W LTC / USD
From the point of view of the weekly chart, this does not look very good for litecoin. Litecoin lost many static and dynamic S / R levels, which were very important for the market. Of the dynamic ones, we lost the 20-week and 50-week moving average for the first time. Thanks to that last drop, we also lost 100-week moving average, which is already a really significant loss.
The last drop didn’t even stop at the $ 110 S / R level. The exchange rate more or less passed this level on the weekly chart. However, the course stopped at 200-week moving average. In other words, a certain part of the shoppers were ready and they managed to stop the decline.
Currently, the exchange rate is consolidating at the S / R level of 110 USD, so with a possible close at this level one can quite possibly expect a rebound. However, the strongest levels start at around $ 80. The biggest “concrete“ we have $ 64 at the beginning of the S / R level. Which we know thanks to the volume profile, according to which it is in the range of 64 – 30 USD a lot liquid cluster.
Otherwise, the volumes are still quite low since last summer. It is more or less the worst since the beginning of autumn and the situation has not improved much in this respect. Just this week we can watch smaller volumes spike.
Indicators
The strongest support on the RSI indicator is around 35 points. We are currently at about 40 points. According to the MACD, the negative momentum naturally intensified again.
- Trump’s inauguration is approaching, but crypto promises may take a while - January 14, 2025
- Fidelity: 2025 will be the year of global Bitcoin adoption - January 14, 2025
- Ethereum: Inflation continues, but bulls continue to target $20,000 - January 14, 2025


