Table of Contents
November 14, 2024, marks a historic day for Bitcoin enthusiasts as the cryptocurrency smashed through its previous all-time high (ATH) to reach a monumental $93,480. This record-breaking move sent shockwaves through the market, reigniting the bull run that has been brewing for weeks. Let’s dive into the rollercoaster journey that brought us here, analyzing key levels, market dynamics, and what lies ahead.

Act I: The Build-Up
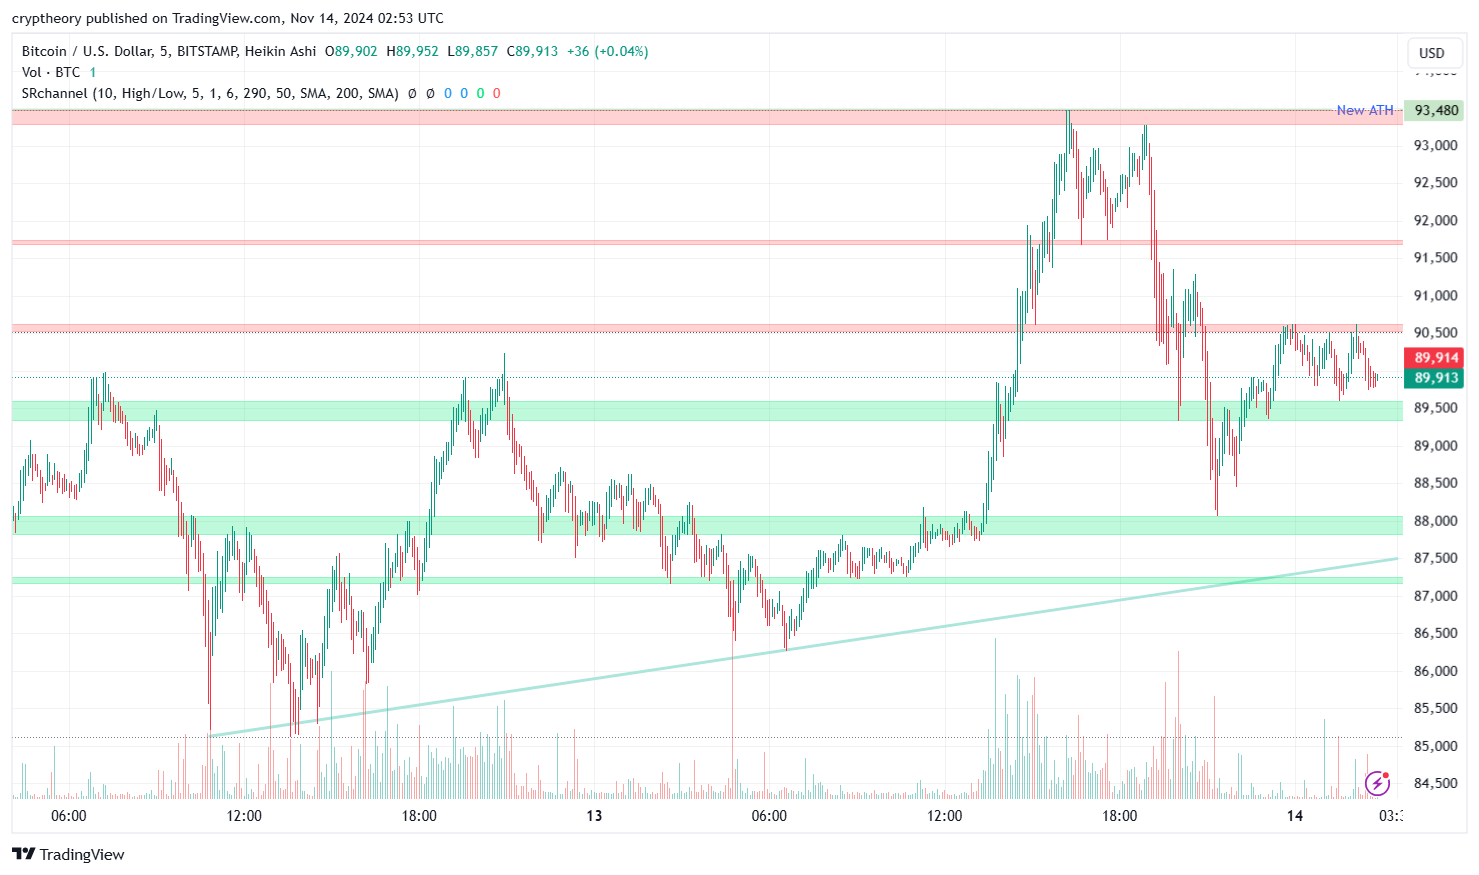
Bitcoin started its day hovering around the $89,500-$90,000 range, consolidating within strong support zones. Traders watched with bated breath as the price flirted with breaking resistance at $91,500, the critical gateway to uncharted territory.
The chart showcases multiple attempts to breach this level, with buyers persistently building momentum. Volume steadily increased, mirroring the growing excitement and demand for BTC as it approached the ATH.
Act II: The Breakout
As the afternoon rolled in, Bitcoin did what Bitcoin does best—defying expectations and soaring beyond limits. The breakout above $91,500 was swift and decisive, triggering an avalanche of buy orders that propelled the price straight to $93,480.
Social media exploded with cheers, memes, and declarations of “Bitcoin to $100k!” as the king of crypto once again proved its resilience and dominance. The breakout was accompanied by significant trading volume, signaling that the rally was fueled by genuine market participation rather than speculative spikes.
Act III: The Retracement
No Bitcoin rally is complete without a dramatic cooldown, and today was no exception. After hitting the ATH, the price retraced slightly to the $89,900-$90,000 range, testing newfound support zones. This pullback is a natural part of Bitcoin’s price action, as traders lock in profits while others prepare to “buy the dip.”
Key support at $89,500 now serves as the foundation for Bitcoin’s next move, with buyers eager to defend this level and maintain the bullish momentum.
Technical Analysis
Support and Resistance Levels
- Support:
- $89,500-$90,000: Immediate support, critical for maintaining bullish sentiment.
- $87,500: Secondary support, aligned with the ascending trendline.
- Resistance:
- $91,500: Former resistance, now a key psychological level.
- $93,500-$94,000: Immediate resistance zone to watch as BTC eyes further upside.
Trendline and Volume
- An ascending trendline from $87,500 underscores Bitcoin’s sustained bullish momentum over the past week.
- Rising volume during the breakout affirms strong buying interest, reducing the likelihood of a fakeout.

Relative Strength Index (RSI)
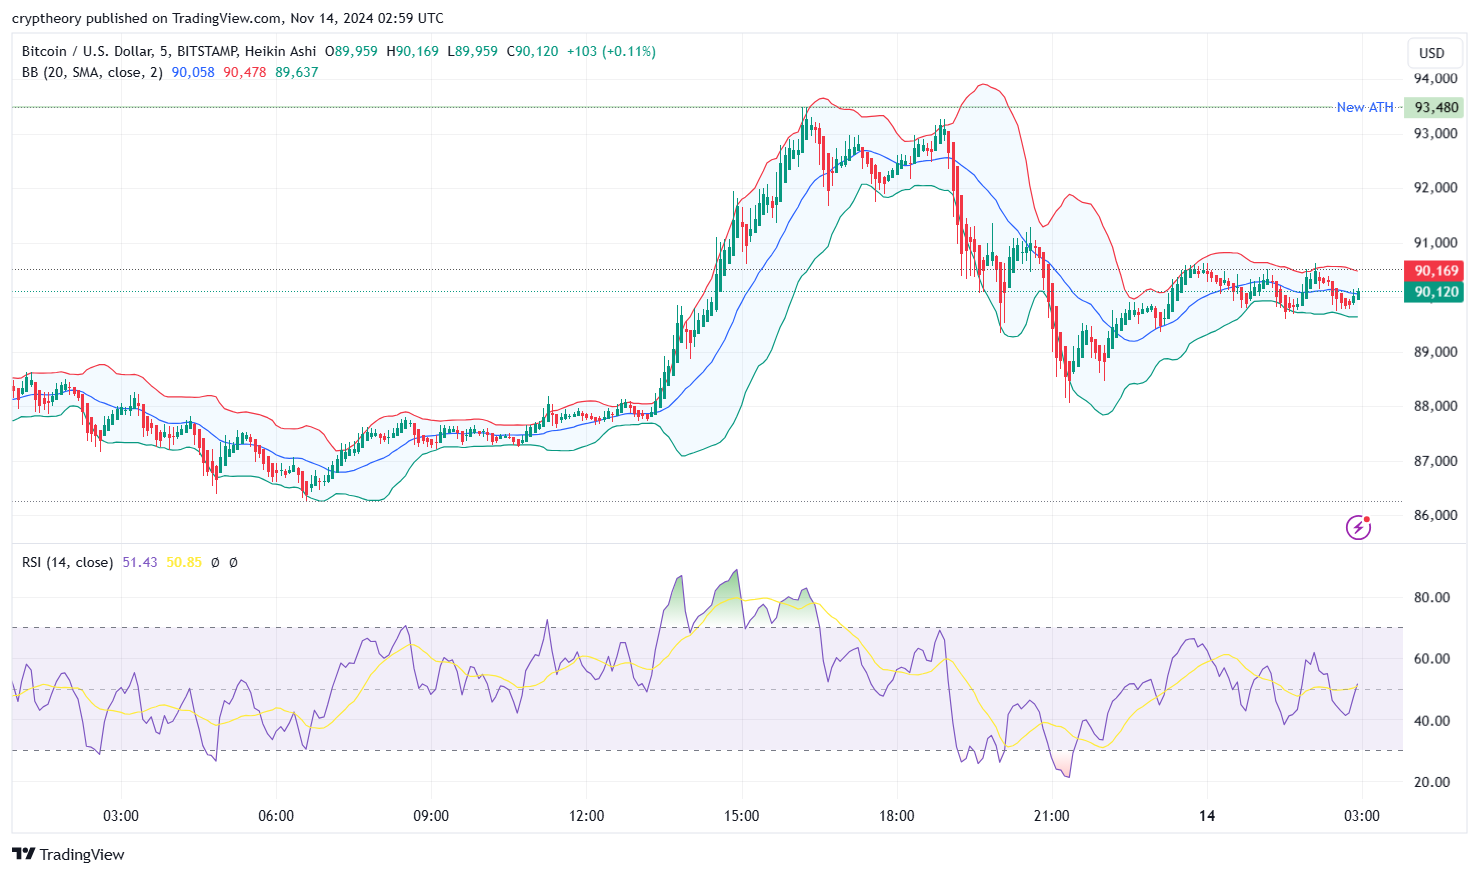
- Current RSI Value: 51.43
- The RSI is in the neutral zone, indicating a balance between buying and selling pressure.
- It suggests that the market is neither overbought nor oversold, signaling consolidation after recent price action.
- RSI-Based Moving Average (MA): 50.85
- The RSI is slightly above its moving average, indicating a minor bullish divergence that could hint at potential upward momentum.
- This alignment suggests buyers have marginally gained control in the short term.
Bollinger Bands
- Current Bollinger Band Levels:
- Upper Band: $90,478
- Middle Band (SMA): $90,058
- Lower Band: $89,637
- Price Position:
- The price is hovering near the middle Bollinger Band, showing a consolidative phase after recent volatility.
- This position often acts as a pivot, where the market decides the next directional move.
- Volatility:
- The bands are relatively wide, reflecting recent sharp price movements, including the rally to the ATH and the subsequent retracement.
- A contraction in the bands would signal a reduction in volatility, potentially leading to a breakout or breakdown.
Market Interpretation
- The RSI and Bollinger Bands suggest that Bitcoin is currently in a consolidation phase following its rally to a new ATH.
- The neutral RSI indicates that neither bulls nor bears have a strong advantage at the moment.
- A breakout above the upper Bollinger Band ($90,478) could indicate a resumption of bullish momentum, while a drop below the lower band ($89,637) might trigger further downside.
Conclusion: Bitcoin’s indicators show a cooling-off period, with the market seeking direction. Traders should watch for the RSI moving significantly above 60 or below 40, along with Bollinger Band breakouts, to anticipate the next major move.
What’s Next for Bitcoin?
The big question now: is $100,000 finally within reach? Analysts believe the strong fundamentals, combined with increased institutional interest and favorable market conditions, make this milestone a real possibility in the near term. However, Bitcoin’s infamous volatility means that traders should brace for potential pullbacks or consolidation periods along the way.
Conclusion
Bitcoin’s new ATH of $93,480 is more than just a number—it’s a statement. It’s a testament to the resilience of the cryptocurrency market, the growing institutional adoption, and the unshakable confidence of its community. As BTC continues its victory lap, all eyes are now on the six-digit milestone that has tantalized traders for years. Will Bitcoin make it to $100,000 before the year ends? Stay tuned, because the ride is far from over!
- What Could Bitcoin’s Price Be in 25 Years? A Lambo or Just a Latte?” 🚀💸 - December 23, 2024
- Solana Price Analysis – December 18, 2024: The Slippery Slope of SOL 🚀📉 - December 18, 2024
- Bitcoin Price Analysis – 16/12/2024: A Dance in the Ascending Channel - December 16, 2024


