Table of Contents
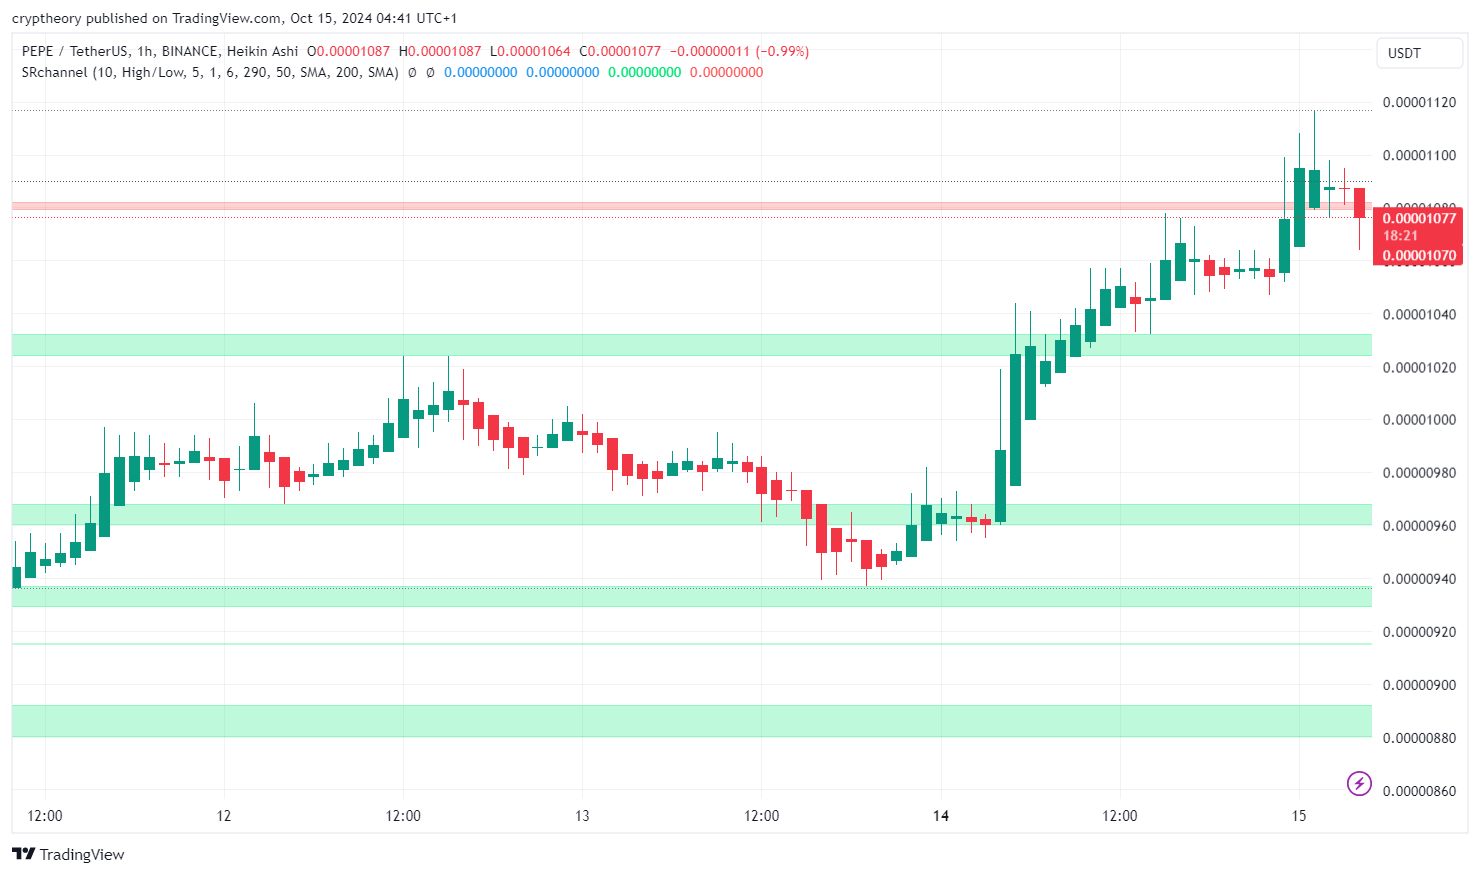
As of October 15, 2024, the price of Pepe (PEPE) is trading around $0.00001077, following a surge of 7.99% over the last 24 hours. The chart PEPE/USDT indicates a period of consolidation after the token reached resistance levels close to $0.00001100. The current price action reflects a testing phase of both support and resistance zones.
PEPE price analysis 15/10/2024
Source: TradingView
Key Observations from the Chart:
- Support Levels:
- There is strong support around the $0.00000940 to $0.00000960 zone, which has held up well over the last few days.
- Another significant support zone is visible between $0.00000980 and $0.00001000, as shown by the highlighted green areas. This level acted as a consolidation zone before the recent upward movement.
- Resistance Levels:
- The primary resistance sits around the $0.00001100 level, which the price has struggled to break. The price spiked briefly above this level before retracing to the current price of $0.00001077.
- A potential secondary resistance can be seen around $0.00001120, as shown by the peaks in the price action.
Market Sentiment
The overall market sentiment for PEPE appears cautiously optimistic, with periods of accumulation around the support zones. The recent upward movement indicates growing demand, though the failure to break the $0.00001100 resistance suggests a potential for short-term consolidation before the next upward push.
Short-Term Outlook:
If the price manages to break above $0.00001100, there could be room for a rally towards $0.00001120 and beyond, testing new highs. On the downside, a drop below $0.00000980 could lead to a retest of the lower support zones around $0.00000940.
Key Indicators
Source: TradingView
- RSI (Relative Strength Index):
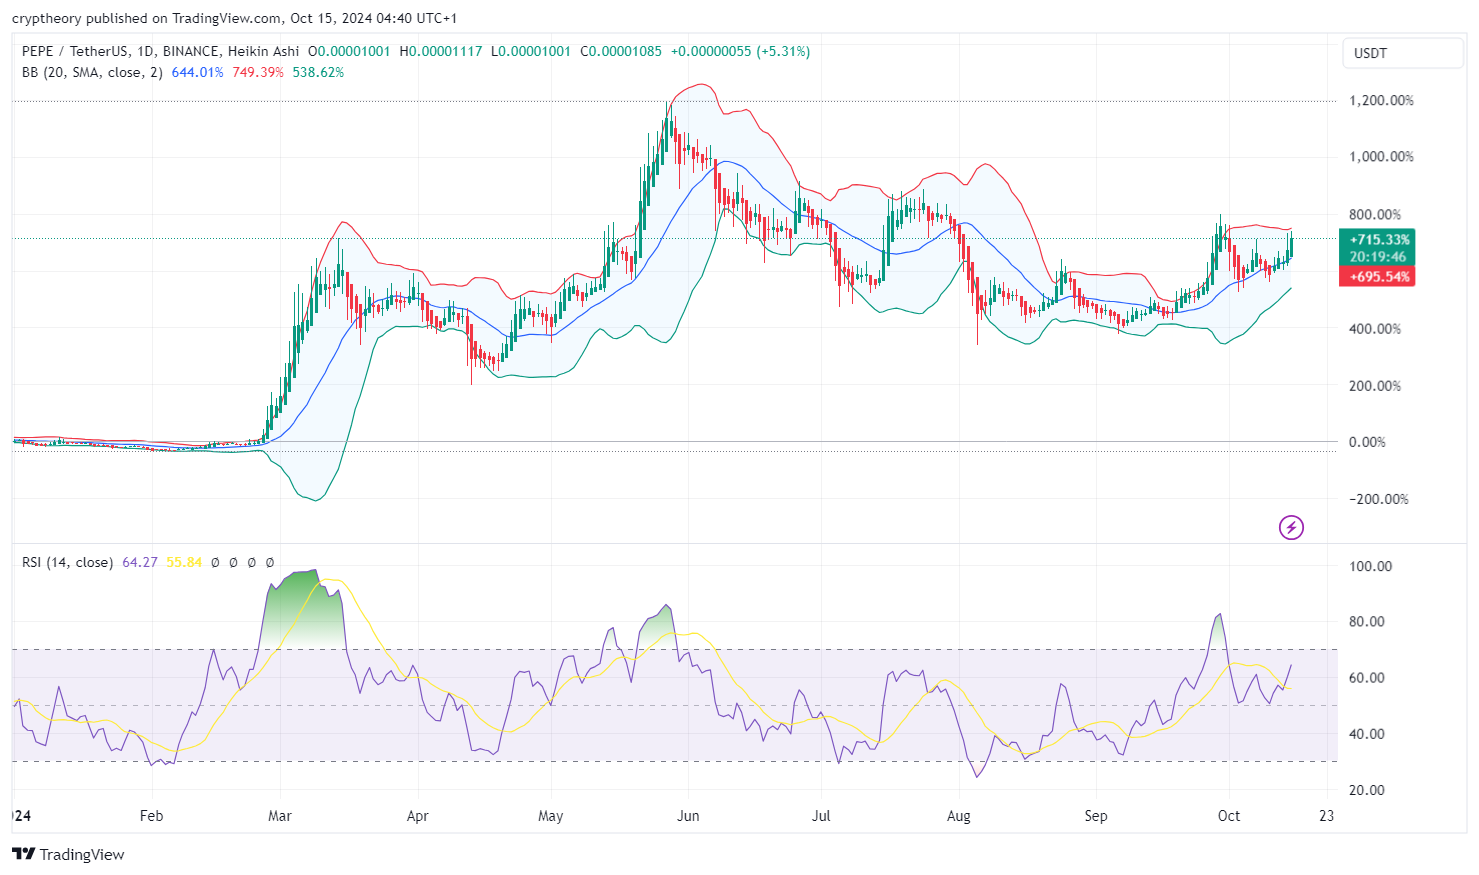
- The RSI is currently at 64.27. This indicates that PEPE is approaching the overbought territory, which typically starts when the RSI value exceeds 70. The current RSI suggests strong bullish momentum, though traders should be cautious of a potential correction if the RSI crosses further into overbought levels.
- Bollinger Bands:
- The chart shows Bollinger Bands with the middle line (20-period SMA) at approximately $0.00001085. PEPE is currently trading near the upper Bollinger Band, which typically signifies higher volatility and potential overbought conditions. Prices near the upper band often suggest the asset may be overvalued in the short term, but if a breakout occurs, it could signal further upside.
- Price Performance (YTD):
- According to the chart, PEPE has shown 715.33% growth since the beginning of the year, a significant increase, reflecting its volatility and potential attractiveness to speculative traders. This dramatic rise showcases PEPE’s performance as one of the standout meme coins for 2024, with substantial price fluctuations driven by market sentiment.
Conclusion
PEPE is currently in a crucial consolidation phase, with support levels providing a strong base and resistance holding back further upward movement. A breakout above the resistance could lead to more bullish momentum, while a breakdown could signal a short-term correction. Traders should monitor the support at $0.00000980 and resistance at $0.00001100 closely in the upcoming sessions.
According to technical analysis, PEPE is poised for a potential bullish breakout as market sentiment remains optimistic. A possible surge could see the coin rally by 50% or more over the next few weeks, as buyers push toward higher price levels
- Solana Price Analysis – December 18, 2024: The Slippery Slope of SOL 🚀📉 - December 18, 2024
- Bitcoin Price Analysis – 16/12/2024: A Dance in the Ascending Channel - December 16, 2024
- What is Monero, Price Predictions for 2025–2030, and Why Invest in XMR? - December 16, 2024


