Table of Contents
Gather around, traders and meme enthusiasts, for the Pepe prophecy is unfolding right before our eyes! Our dear frog-themed coin is giving us a chart worthy of a financial soap opera. Today’s action on PEPE/USDT has all the drama, suspense, and intrigue you could ever hope for in a cryptocurrency.

The Almighty Symmetrical Triangle
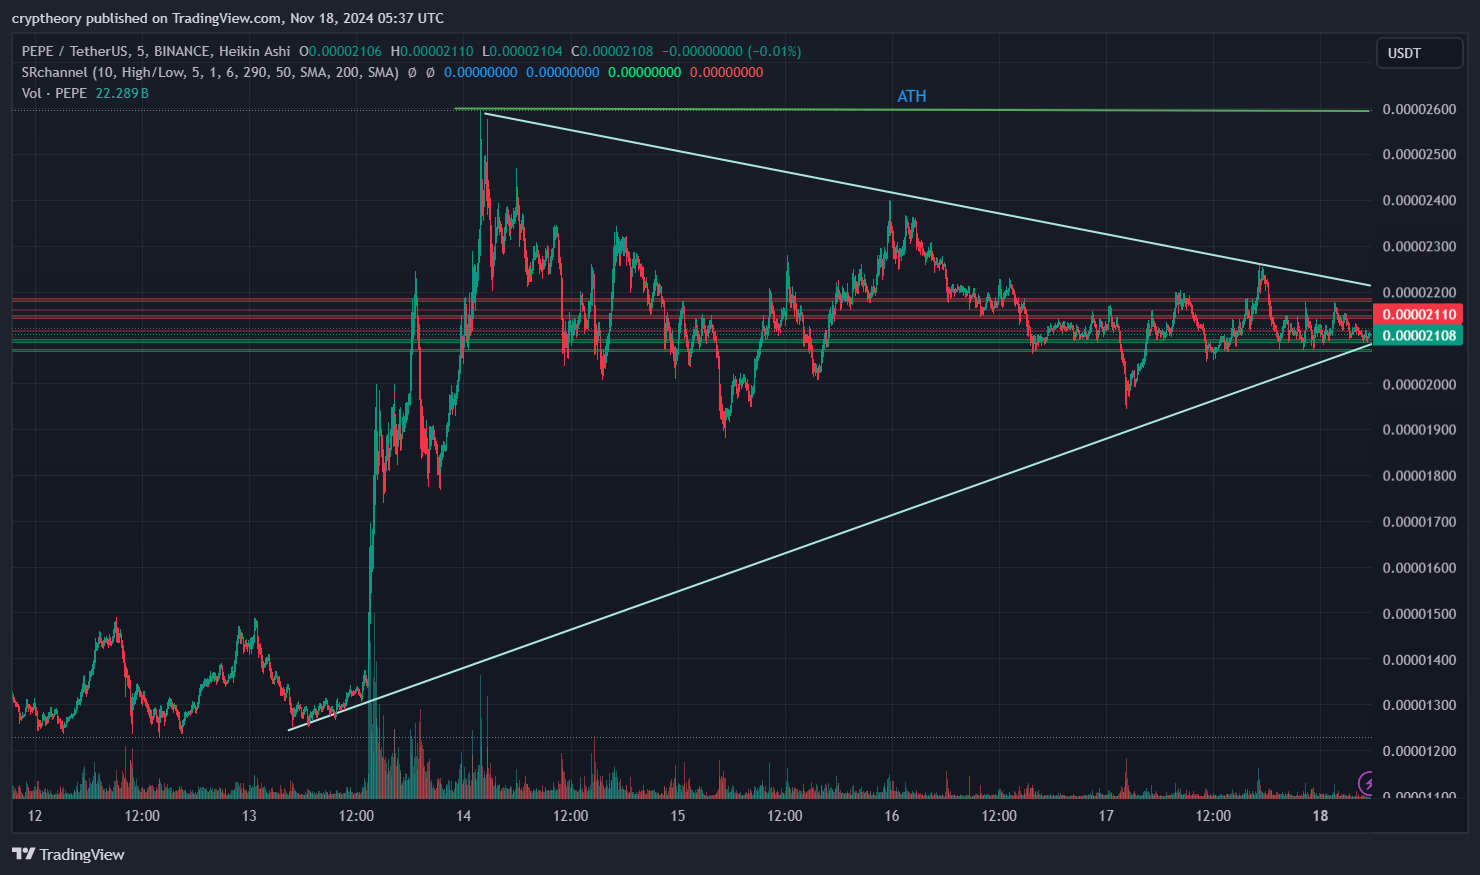
Looking at the chart, Pepe is clearly squeezing itself into a symmetrical triangle—like a frog wedging into a pond that’s just slightly too small. It’s as though Pepe is meditating, preparing for a leap that could make or break its tadpole dreams. The triangle is narrowing, with Pepe’s price consolidating like it’s on a caffeine detox. Expect fireworks soon, folks, because the closer we get to the apex, the more likely Pepe is to ribbit up or croak down.
Support and Resistance: The Frog Pits
- Support: Pepe’s sturdy lily pad is around 0.00002100 USDT. Every time the price dips here, it feels like Pepe’s frog army is screaming, “HODL!” Could this be the invincible pond edge that keeps our hero afloat?
- Resistance: Ah, the cruel ceiling at 0.00002200 USDT. This is Pepe’s “glass pond” moment—he bumps against it repeatedly, trying to break through like an ambitious frog chasing flies.
Volume: A Tadpole’s Whisper
The trading volume has been like a shy croak in the swamp. Traders seem hesitant, waiting for the Pepe explosion that could send us into either “To the Moon” or “To the Bottom of the Pond” territory. If the volume spikes, prepare for volatility that might just rival Pepe’s original meme debut.

Relative Strength Index (RSI)
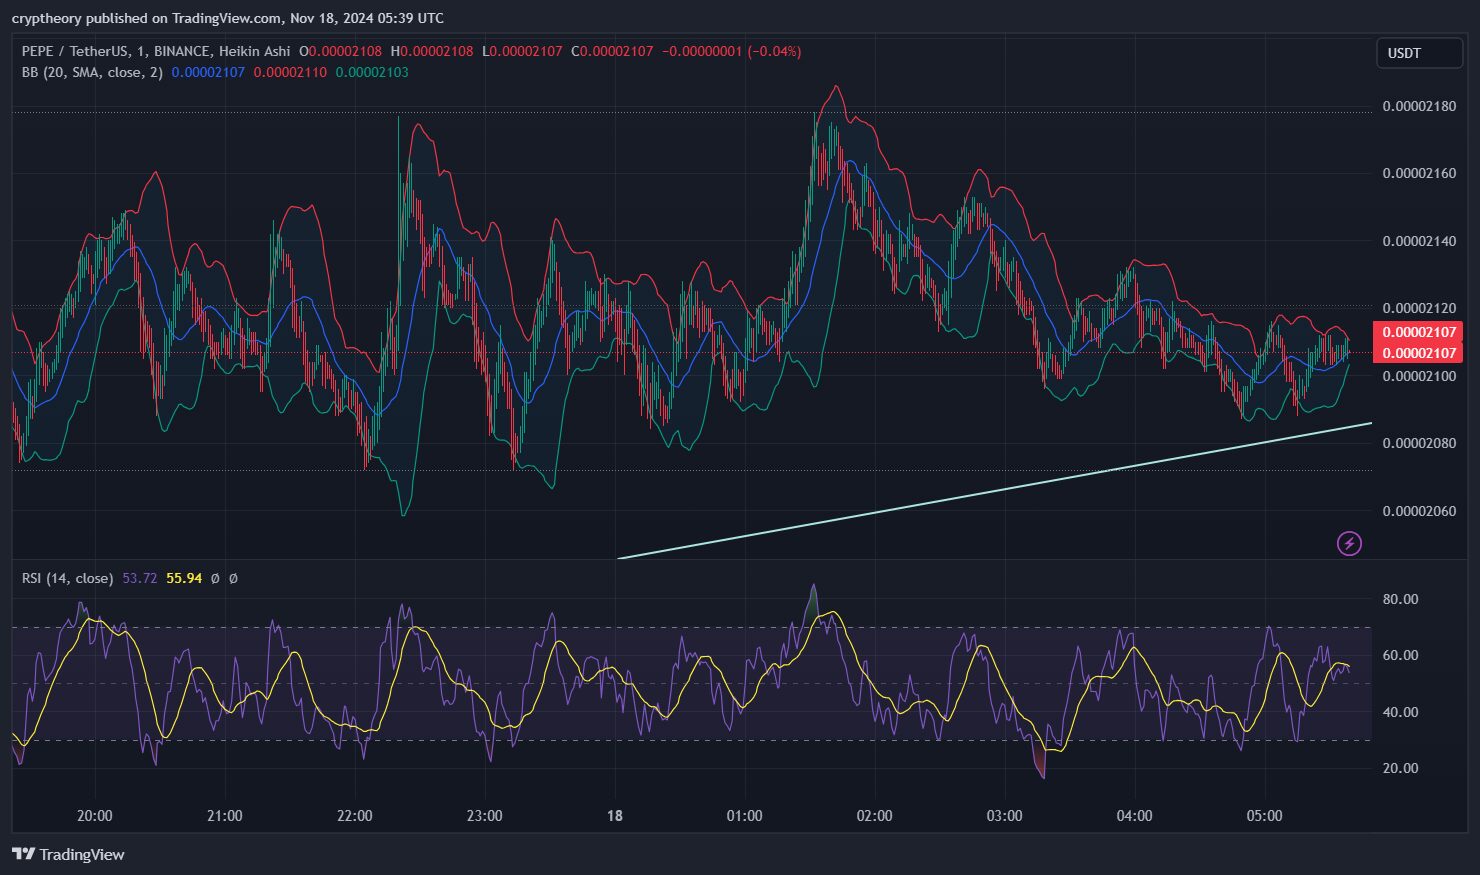
- RSI Value: The RSI (14) is currently around 53.77, which indicates a neutral position. It’s slightly leaning towards bullish momentum but not strongly overbought or oversold.
- RSI Moving Average (RSI-based MA): The RSI moving average is approximately 55.94, which is slightly above the RSI itself, suggesting a potential upward momentum shift.
Bollinger Bands
- Upper Band: Approximately 0.00002160.
- Middle Band (SMA 20): Approximately 0.00002107 (acting as a pivot point where the price is consolidating).
- Lower Band: Approximately 0.00002054.
- Observation: The price is hugging the middle Bollinger band, showing consolidation within a narrow range. The bands are not significantly widened, indicating low volatility.
These metrics suggest that Pepe’s price is in a consolidation phase, with RSI leaning neutral and Bollinger Bands reflecting reduced volatility. It hints at a potential breakout scenario as volatility builds up. Watch closely for movement above or below the bands for a clearer trend direction!
Price Action: The Frog’s Journey
The price is hopping back and forth within the triangle, teasing both bulls and bears. It’s like watching a frog on a trampoline—sometimes it’s up, sometimes it’s down, and nobody knows when it’ll leap for real. The narrowing triangle suggests that Pepe’s next move could be explosive enough to give even the most seasoned traders an existential crisis.
The Meme Factor
Let’s be real—this is Pepe we’re talking about. Fundamentals? What fundamentals? This coin thrives on memes, chaos, and the collective will of its community. One viral tweet, and this chart could become utterly irrelevant. However, without such a catalyst, Pepe might just keep treading water.
The Verdict
So, what’s the play here? Pepe is the ultimate wild card. If you’re feeling lucky, you might ride the amphibian wave to glory. But remember, this is crypto—where fortunes are made and lost faster than Pepe can blink.
Trading Idea
- Direction: Wait for a breakout (above 0.00002200 for long positions, below 0.00002100 for shorts).
- Stop Loss: If you’re trading long, keep it just below the support. If shorting, place it above the resistance.
- Target: A breakout could aim for 0.00002450 on the upside or a dive to 0.00002000 on the downside.
For now, let’s sit back, relax, and enjoy the Pepe show. May the memes be with you. 🐸📈
- What Could Bitcoin’s Price Be in 25 Years? A Lambo or Just a Latte?” 🚀💸 - December 23, 2024
- Solana Price Analysis – December 18, 2024: The Slippery Slope of SOL 🚀📉 - December 18, 2024
- Bitcoin Price Analysis – 16/12/2024: A Dance in the Ascending Channel - December 16, 2024


