Table of Contents
Ladies, gentlemen, and amphibian enthusiasts, grab your magnifying glasses and let’s dive into the mesmerizing swamp that is Pepe’s price action today. The chart is more dramatic than a soap opera, featuring breakouts, pullbacks, and enough tension to keep us glued to our screens. Let’s dissect the frog…er…chart.

Current Price Action
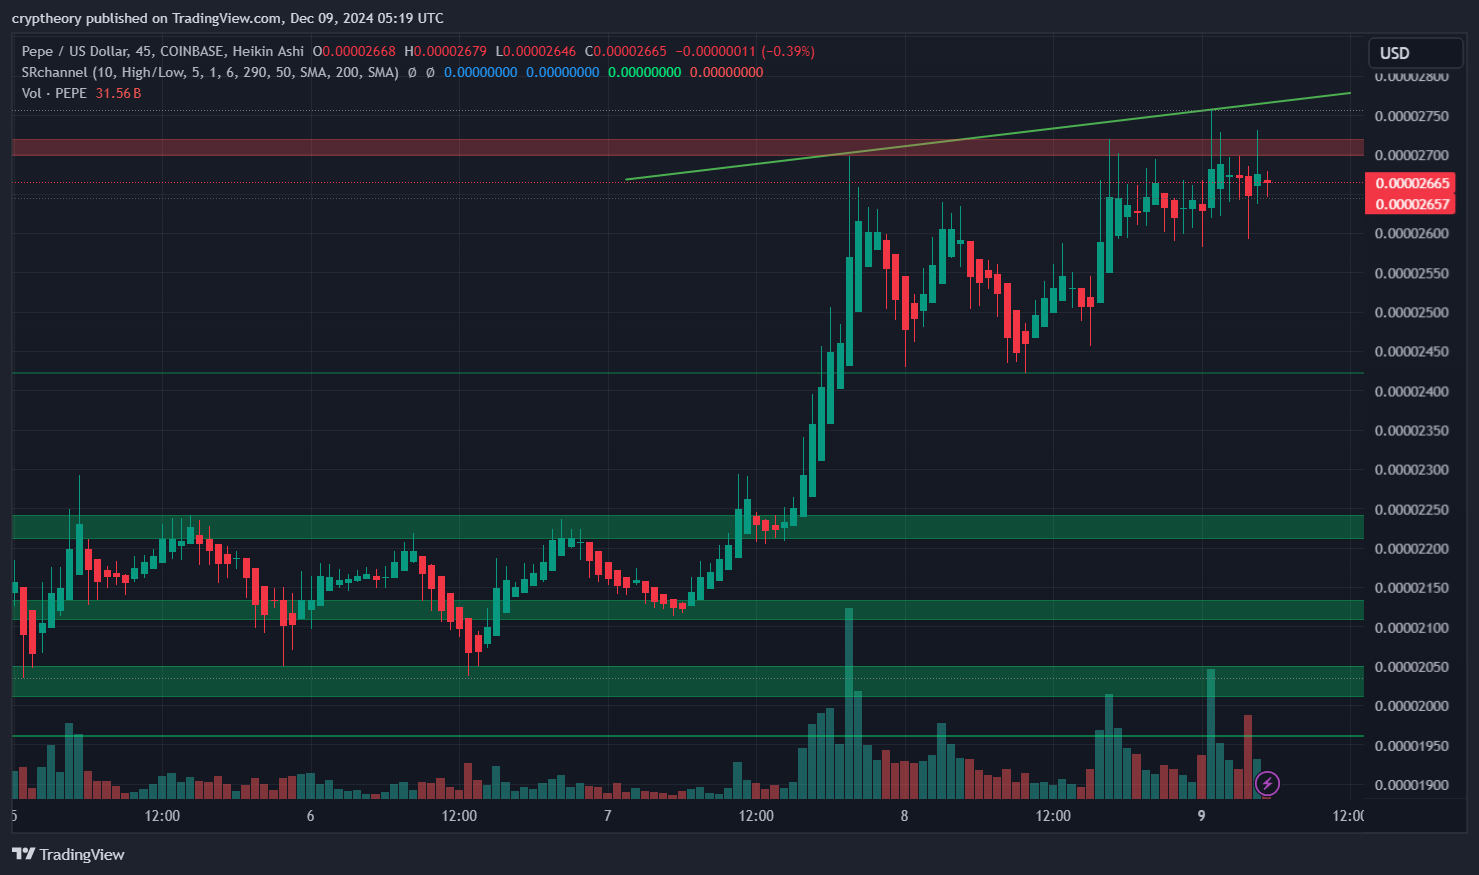
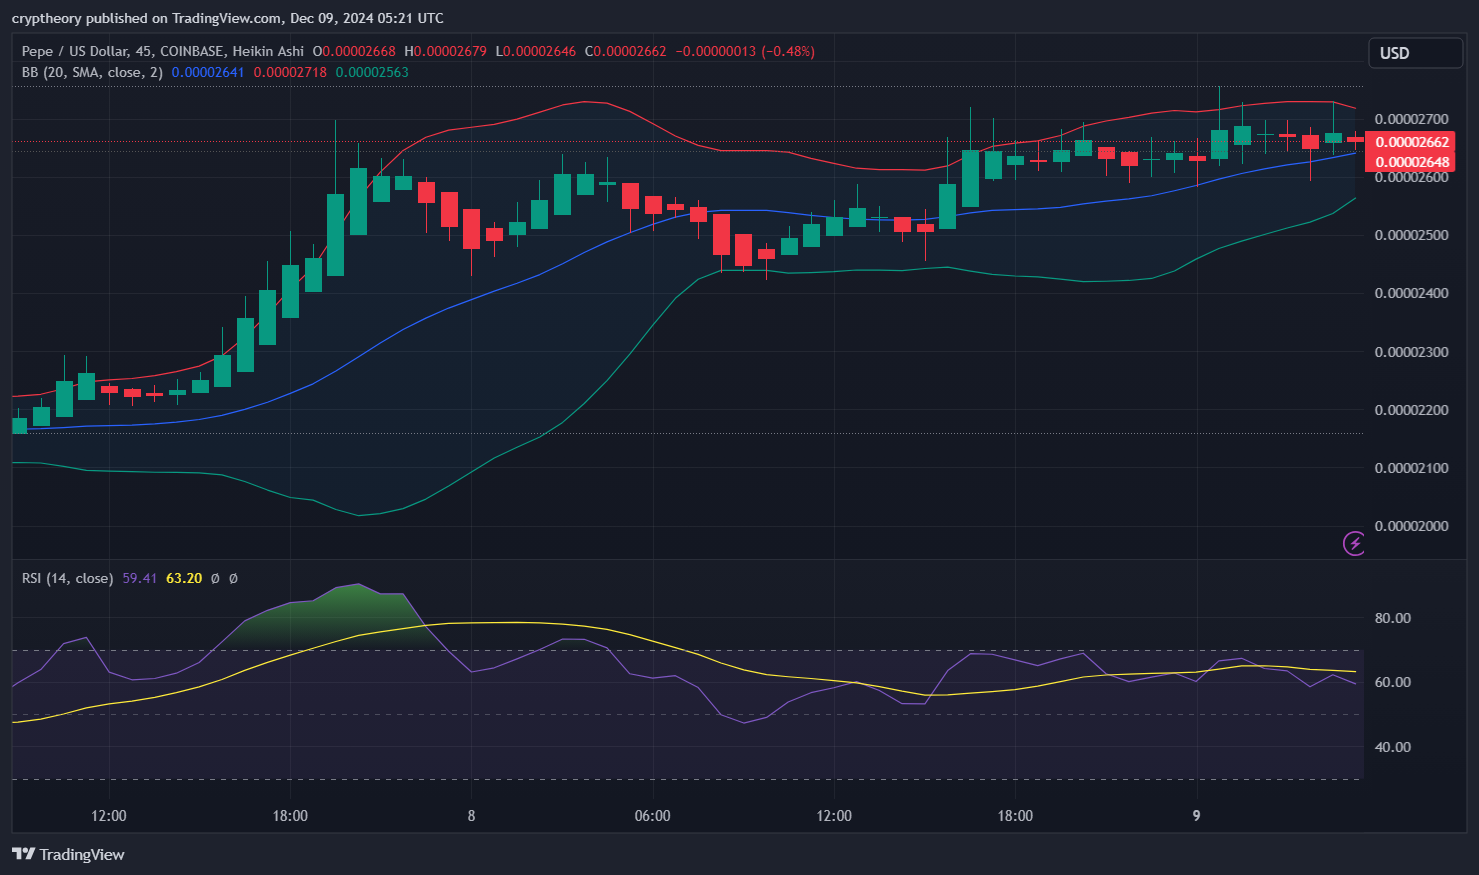
Pepe is currently trading at $0.00002665, showing signs of consolidation just below the critical resistance level at $0.00002700. It’s like our beloved frog is peeking over the edge of a lily pad, deciding whether to leap into uncharted waters or slide back into the murky depths of support zones.
Key Levels to Watch
- Resistance:
- $0.00002700: This level is the frog’s nemesis. Every time Pepe gets close, the bears slap it back down like a mischievous fly. Breaking this would signal a leap towards the green pastures of $0.00002800.
- $0.00002750 (Trendline Resistance): Sitting ominously above, this trendline is like an invisible ceiling that’s been capping Pepe’s dreams of grandeur.
- Support:
- $0.00002600: A trusty lily pad for Pepe, this level has been catching every slip with grace.
- $0.00002500: A stronger safety net lies here. Losing this would send Pepe tumbling back into deeper waters, possibly revisiting $0.00002250.
Volume: The Silent Croak
Looking at the volume spikes, it’s clear Pepe recently had its moment of glory, breaking free from $0.00002500 and rallying to the current level. However, the trading volume has been tapering off, indicating that traders are cautious, waiting for a decisive breakout or breakdown. Pepe’s community needs to croak louder if we’re going to see explosive movement.
Trend Analysis: A Frog in Ascent
Pepe has been riding a beautiful ascending trendline, starting from the swampy depths of $0.00002150. This trendline suggests that the frogs are hopping higher, step by step. However, the proximity to the resistance suggests that Pepe’s legs might be getting tired. A break above the trendline resistance at $0.00002750 could send Pepe hopping toward new highs.
Indicators: Pepe’s Compass
- Simple Moving Average (SMA 50 & SMA 200):
- Pepe is sitting comfortably above both the 50 and 200 SMAs, a strong indicator of bullish momentum. The SMA 50 is acting like a springboard for further growth.
- Support Zones:
- The green support boxes clearly show where the frog armies have successfully defended Pepe from bear attacks. These zones provide confidence for short-term buyers.

Sentiment Analysis: The Frog’s Vibe
Pepe isn’t just a meme—it’s a movement. Sentiment remains strong as the community rallies around the recent price action. However, without a fundamental catalyst or a viral meme to fuel the fire, Pepe might continue consolidating in the short term.
What’s Next for Pepe?
The Bullish Scenario:
If Pepe can break above $0.00002700, it could quickly retest $0.00002750 (trendline resistance). A decisive breakout there would open the door for a move to $0.00002800 and beyond, potentially targeting $0.00003000 as the next major psychological level.
The Bearish Scenario:
Failure to hold above $0.00002600 could see Pepe slide down to $0.00002500, where the frogs would need to regroup. Losing this level could signal a deeper pullback to $0.00002250, where the next support lies.
Conclusion:
Pepe is in a critical position, consolidating just below a significant resistance level. The ascending trendline and strong support levels suggest that the frogs are still in control. However, for Pepe to hop into the history books, it needs a spark—be it a breakout above $0.00002750 or a fresh meme-driven wave of enthusiasm.
For now, let’s sit back and enjoy the show. Will Pepe leap into the moonlight, or will it retreat to its lily pad for a breather? Only time (and volume) will tell. Ribbit ribbit, traders! 🐸📈
- Chainlink Price Analysis – January 9, 2025: The Struggle for $20 and Beyond! - January 9, 2025
- 📊 Kekius Maximus Price Analysis – January 7, 2025 🎭 - January 7, 2025
- 🚀 TON Price Prediction – January 6, 2025 📊🤖 - January 6, 2025


