Table of Contents
On November 13, 2024, Shiba Inu (SHIB) provided traders with a textbook example of volatility as it barked its way up to resistance zones before retreating with its tail between its legs. In true meme coin fashion, SHIB showcased dramatic swings, high-volume surges, and the kind of price action that keeps traders glued to their screens.
Source: TradingView
The Barking Ascent: A Glimpse at Glory
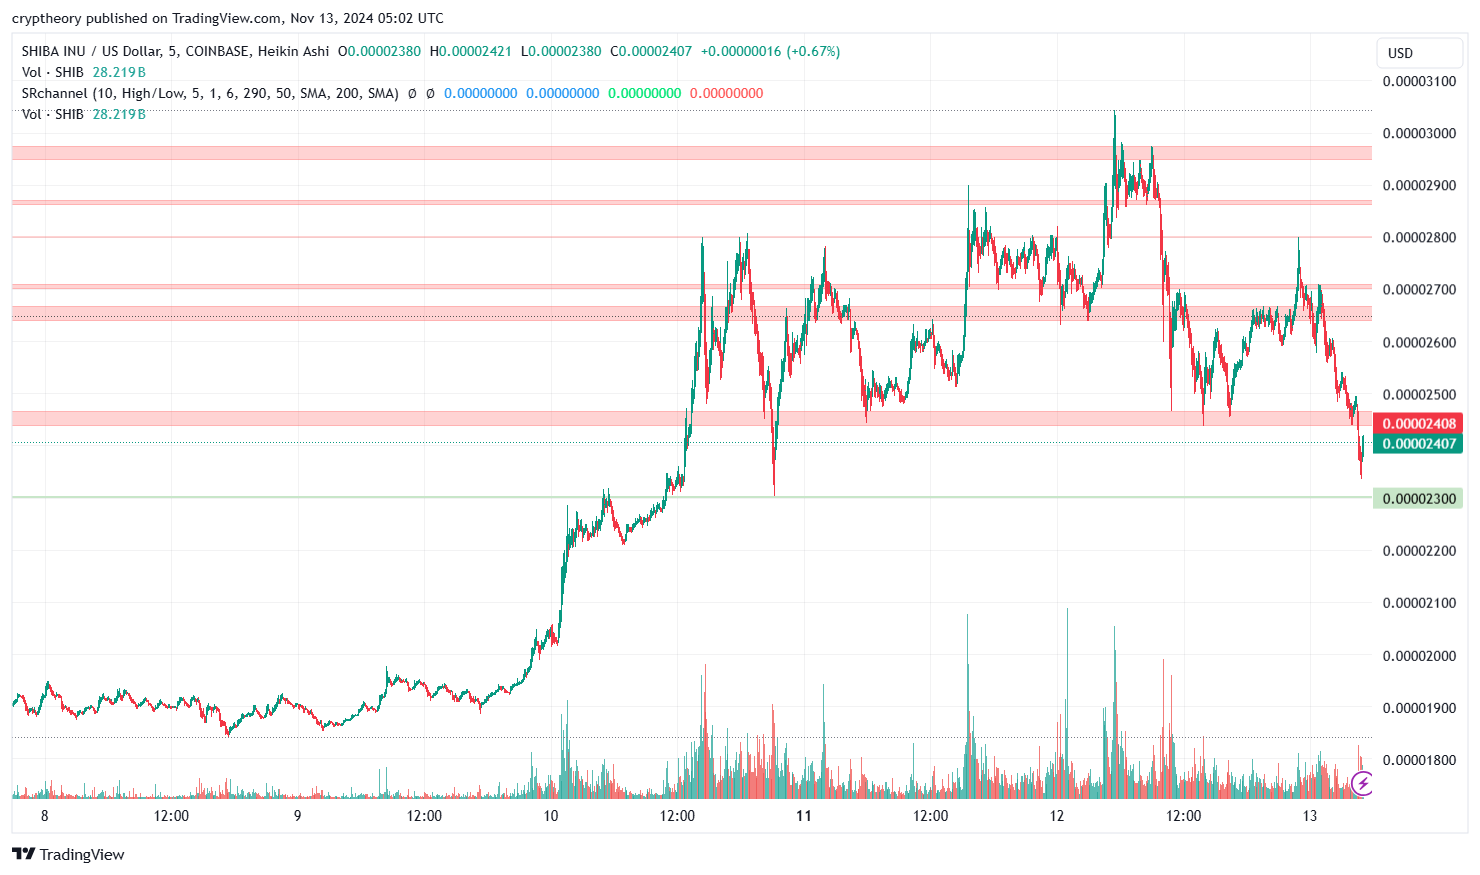
SHIB began the weekend with an impressive rally, leaping from 0.00002230 to a high of 0.00003100, igniting hope in the ShibArmy that another massive moonshot was in the making. Social media buzzed with chatter about a “SHIB breakout,” and FOMO kicked in for latecomers who scrambled to join the pack.
The rally was backed by strong volume, as seen in the increasing trading activity during this bullish phase. SHIB found solid support around the 0.00002300 level, acting as a launchpad for its upward sprint.
Resistance Strikes Back: The Ceiling at $0.00003100
However, like a dog chasing its tail, SHIB struggled to maintain momentum at higher levels. The 0.00003100 zone, a significant resistance, proved too tough to crack. Sellers quickly capitalized on the rally, causing a sharp pullback to 0.00002700, followed by further consolidation.
The red resistance zones between 0.00002700 and 0.00003100 created a range where SHIB seemed to oscillate aimlessly, much like a distracted pup.
The Whimpering Decline: A Case of Overexcitement
As we approached November 13, SHIB’s energy waned, and the price tumbled toward the critical support zone at 0.00002300. This level, highlighted in green on the chart, remains the last stronghold for bulls. Any breach below this could send SHIB to the doghouse, testing lower levels near 0.00002100 or 0.00001900.
The rapid decline in trading volume during the sell-off phase suggests that the excitement of the initial rally has faded, leaving only the most loyal ShibArmy members holding the line.
Technical Highlights
- Support and Resistance Zones:
- Support:
- 0.00002300: Strong buy zone and critical for maintaining bullish hope.
- 0.00002100: The next key level if the current support fails.
- Resistance:
- 0.00002700: Immediate resistance and key to reigniting bullish momentum.
- 0.00003100: The ultimate hurdle for SHIB bulls to reclaim its upward trajectory.
- Support:
- Volume Analysis:
- Significant spikes in volume during the rally suggest strong participation during bullish moves.
- The decline in volume during the sell-off phase indicates reduced enthusiasm, with traders waiting for new triggers.
- Market Sentiment:
- After the sharp pullback, market sentiment is neutral to slightly bearish. Many traders are eyeing the 0.00002300 support for a potential bounce.

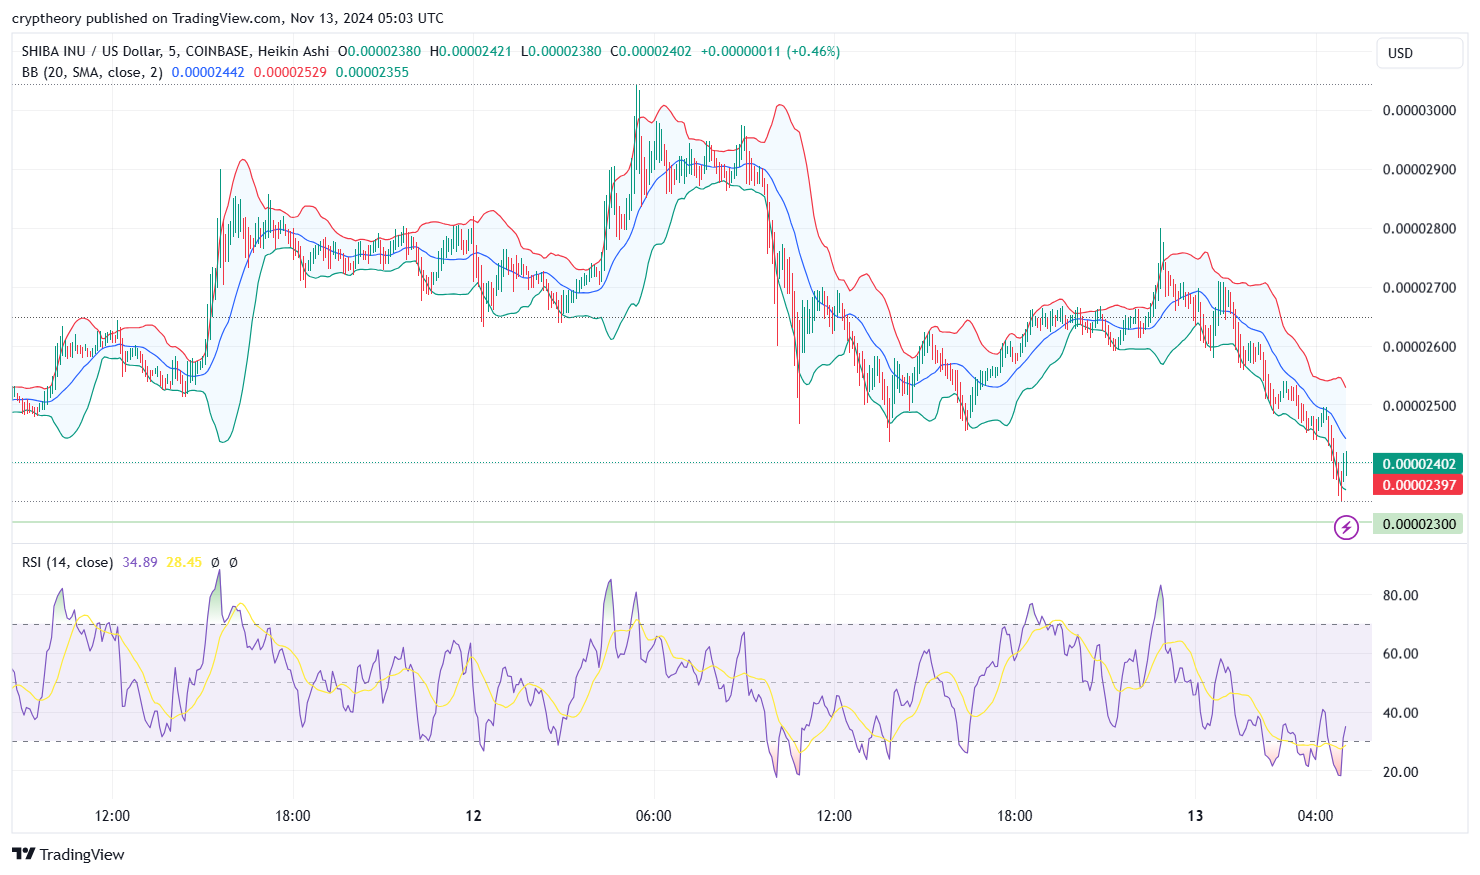
- Current RSI Value: 34.89
- The RSI is in the lower neutral to oversold zone, indicating bearish momentum but also hinting at a potential reversal as it approaches oversold levels.
- The proximity to 30 (oversold threshold) shows that selling pressure has been significant but may slow down soon.
- RSI-Based Moving Average (MA): 28.45
- The RSI has crossed above its MA, signaling that selling momentum is easing and a possible bounce could occur.
- This divergence between RSI and its MA is a possible early sign of a short-term bullish reversal or stabilization.
Bollinger Bands
- Current Levels:
- Upper Band: 0.00002529
- Middle Band (SMA): 0.00002442
- Lower Band: 0.00002355
- Analysis:
- The price is hovering near the lower Bollinger Band, indicating that SHIB is in an oversold condition within the context of Bollinger Bands.
- This suggests that the price may consolidate or bounce back toward the middle band (SMA) if buying interest picks up.
- The bands are relatively wide, indicating recent high volatility, but they are beginning to narrow, suggesting that the market may enter a consolidation phase soon.
Key Observations
- Price Position:
- SHIB is trading near critical support at 0.00002300, aligning with both the lower Bollinger Band and the oversold RSI zone, which may serve as a bounce point.
- Market Dynamics:
- The combination of oversold RSI and price hugging the lower Bollinger Band could attract buyers, especially if volume picks up.
- If the price fails to hold above 0.00002300, further declines to 0.00002150 or lower could occur.
Conclusion
- The RSI and Bollinger Bands suggest SHIB is oversold in the short term, and a bounce back toward the middle Bollinger Band (0.00002442) is possible if buying pressure increases.
- However, if bearish momentum persists and support at 0.00002300 breaks, the next leg down may target 0.00002150. Watch for RSI movements back above 40 or a sustained close above the middle Bollinger Band for confirmation of a bullish recovery.
The Woof and the Whimper: Outlook
SHIB’s weekend journey was like an overly excited dog at a park—sprinting wildly, chasing dreams, and then collapsing into a nap. The high at 0.00003100 felt like a tennis ball just out of reach, and now it’s lounging near support, contemplating its next move.
For the ShibArmy, this is just another day in the world of meme coins. Whether SHIB consolidates or breaks lower, one thing is certain: the excitement is far from over. Keep those leashes tight, traders, because this pup has more tricks up its sleeve.
Conclusion
Shiba Inu may have stumbled after an impressive rally, but it remains a volatile asset with plenty of potential for sharp moves. Bulls must defend 0.00002300, while bears will aim for a breakdown to lower levels. For now, SHIB traders should prepare for more unpredictable action—because in the world of meme coins, anything can happen!
- Solana Price Analysis – December 18, 2024: The Slippery Slope of SOL 🚀📉 - December 18, 2024
- Bitcoin Price Analysis – 16/12/2024: A Dance in the Ascending Channel - December 16, 2024
- What is Monero, Price Predictions for 2025–2030, and Why Invest in XMR? - December 16, 2024


