Table of Contents
Woof woof! The SHIB army might need more dog biscuits to handle the recent rollercoaster. Let’s dive into Shiba Inu Price Analysis.
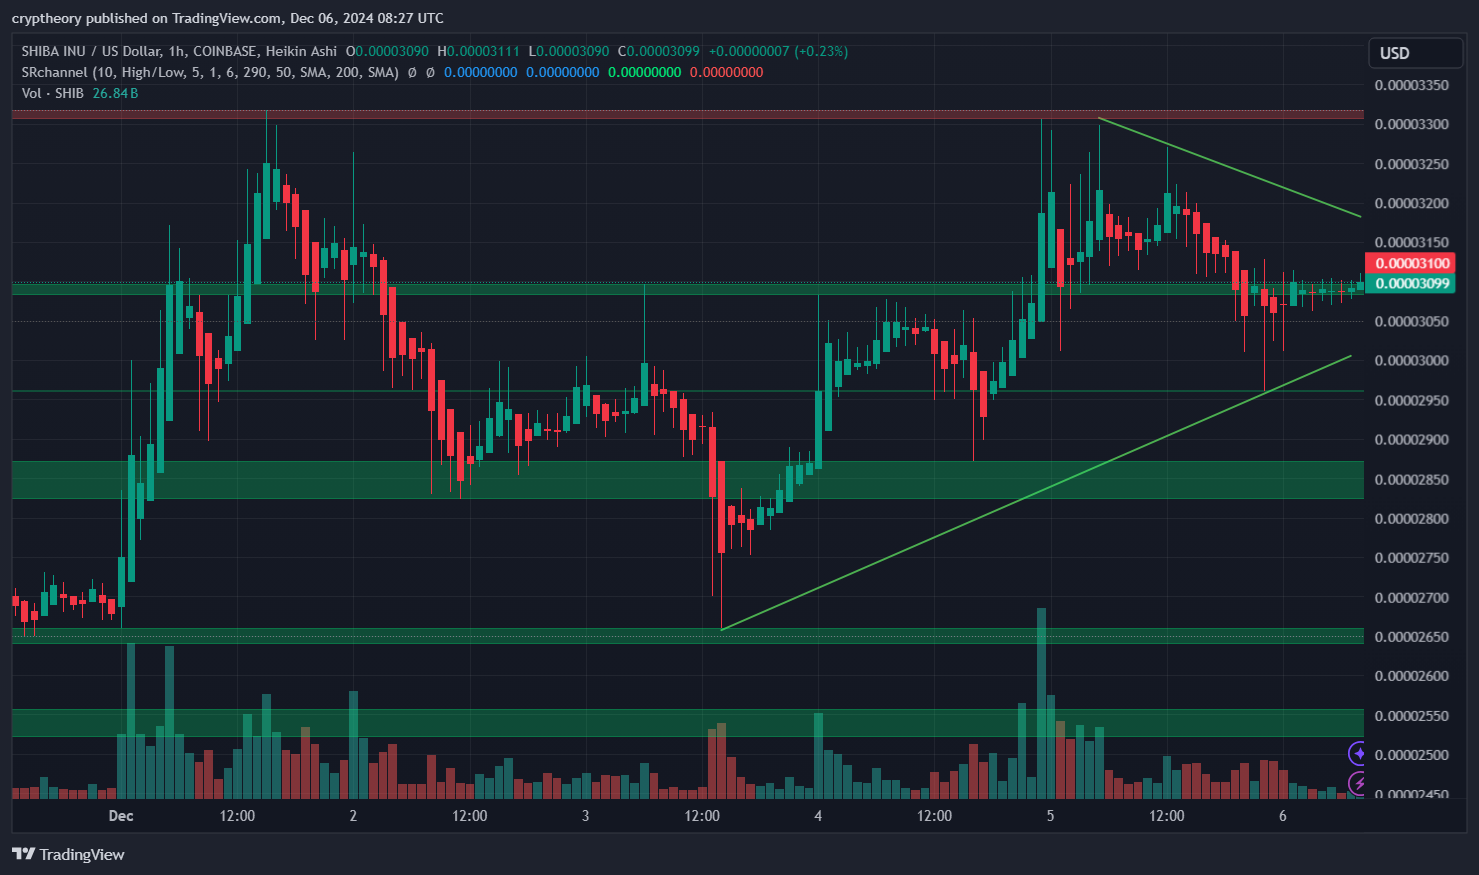
Looking at the 1-hour chart, Shiba Inu appears to be chasing its own tail, oscillating between the green support zones and the ominous resistance levels overhead. Let’s dive in and see what this clever little pup is up to.

Key Levels:
- Resistance Bone (Ceiling):
SHIB attempted a breakout to the moon (or at least to 0.00003350), but it got a resounding “stay down, pup” from the resistance levels around 0.00003150 to 0.00003300. This upper range is guarded like a cat protecting its perch, leaving SHIB no choice but to retreat for now. - Support Bone (Floor):
Down below, the 0.00002900–0.00002850 level offers a comfy dog bed of support. This zone seems to be where SHIB catches its breath after running around too much. If this level breaks, SHIB might find itself digging for bones back at 0.00002750.
Patterns and Indicators:
- The Green Dog Park (Consolidation Zone):
The chart reveals SHIB bouncing like a hyperactive puppy in a clearly defined range. This sideways movement shows indecision—are we going for the treat on the upside, or are we digging a hole to the downside? The Heikin Ashi candles show SHIB sniffing for direction. - Volume Tail Wagging:
Volume has seen some impressive spikes, indicating interest from traders. However, recent candles show quieter tails, suggesting traders are taking a nap—or maybe just watching SHIB nervously. - Ascending Dog Leash (Trendline):
The upward-sloping trendline from the depths of 0.00002850 provides hope for the SHIB faithful. It’s like a leash pulling SHIB slowly upward, giving the bulls a chance to bark louder than the bears. - The Triangle of Doom (Descending Triangle):
As SHIB reaches for higher bones, it faces an awkward narrowing of space, like a dog trying to squeeze under a low fence. The descending triangle pattern warns of potential bearish energy. If SHIB can’t break the 0.00003100 resistance, it might tumble, tail between its legs.

RSI (Relative Strength Index):
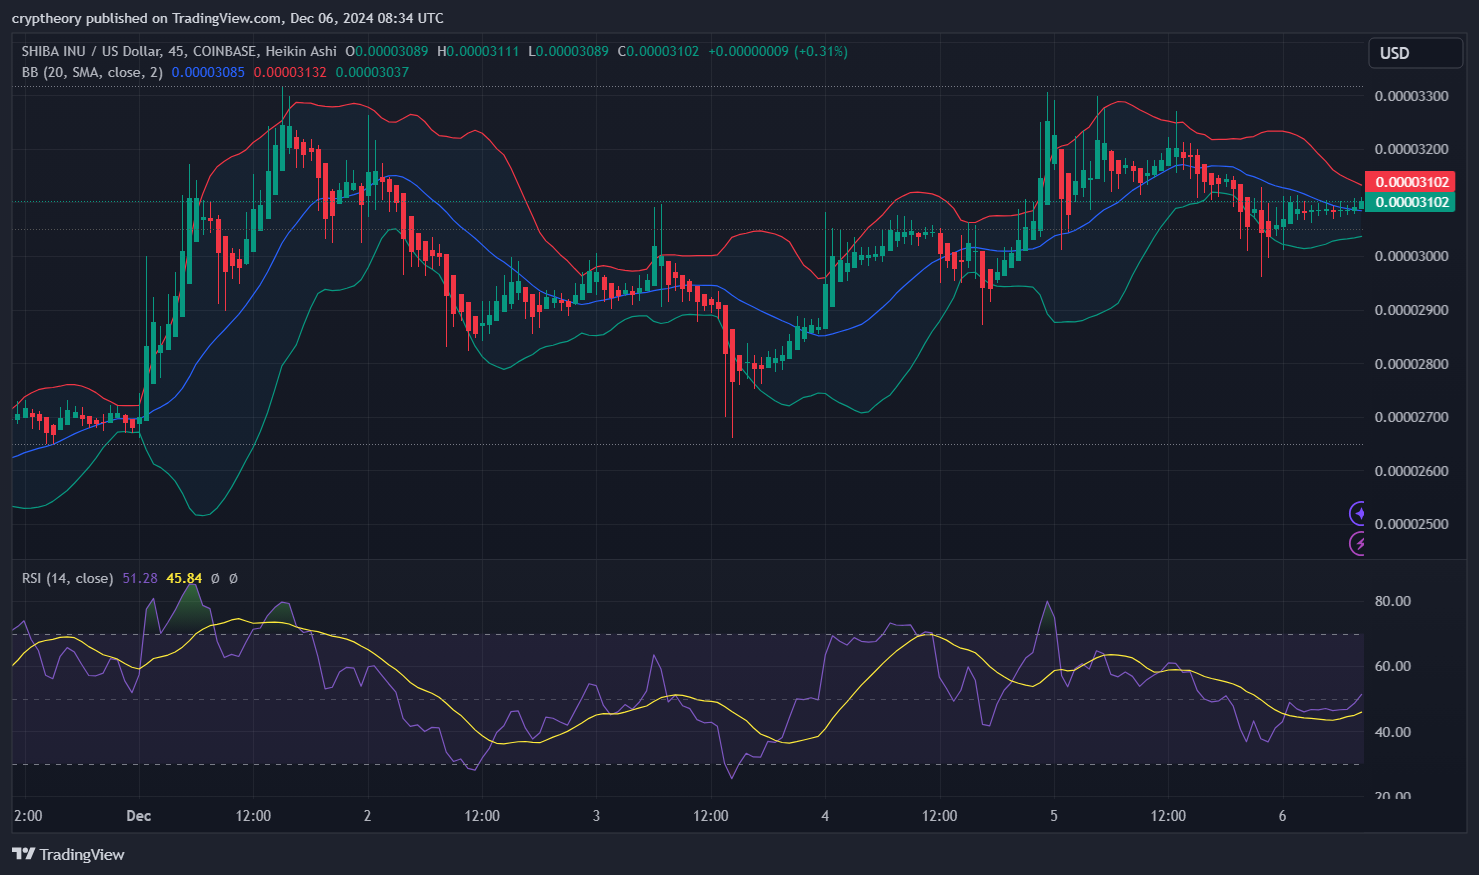
- Current RSI Value: 51.28
The RSI is hovering near the neutral 50 mark, indicating that the market is balanced between bullish and bearish momentum. SHIB isn’t currently overbought (above 70) or oversold (below 30), which points to a potential consolidation phase. - RSI Momentum:
The RSI has been oscillating between 40 and 60 in recent sessions, showing a lack of strong directional movement. Traders should monitor for a break above 60 or below 40 to spot the next trend.
RSI-Based Moving Average:
- RSI MA Value: 45.84
The moving average of the RSI is slightly lower than the current RSI, suggesting that the recent momentum is mildly bullish, but the overall trend remains weak. This difference might indicate that the RSI is trying to move higher, but without strong conviction.
Bollinger Bands:
- Upper Band: 0.00003312
The upper Bollinger Band indicates the resistance level where SHIB might struggle to push higher unless significant bullish pressure emerges. - Lower Band: 0.00003037
The lower Bollinger Band acts as a key support zone. If SHIB breaks below this level, it could signal increased bearish momentum. - Middle Band (SMA): 0.00003132
The middle Bollinger Band, representing the 20-period simple moving average, aligns closely with the current price. This reinforces the idea of sideways movement in SHIB, as the price clings to this band.
Key Observations:
- Bollinger Band Squeeze:
The bands have narrowed, signaling low volatility. This often precedes a significant price movement, either upwards or downwards. Traders should be prepared for a potential breakout. - RSI Neutrality:
The RSI being close to 50 suggests indecision. A break above 60 could signal bullish momentum, while a drop below 40 might confirm bearish dominance. - Price Interaction with Bands:
The price is close to the middle band, indicating equilibrium. A move toward the upper or lower band will reveal the next direction for SHIB.
This Shiba Inu price analysis highlights a period of consolidation with potential for volatility ahead. Keep a close eye on Bollinger Band expansion and RSI crossing key levels for clearer signals!
The Sentiment:
The Market: “Who’s a good boy?”
Sentiment is mixed—bulls wag their tails while bears bare their teeth. The Shiba Inu community remains loyal, holding out hope for another parabolic bark-fest. However, cautious traders eye those lower support zones as potential play areas for SHIB’s next big move.
Short-Term Prognosis:
- Bullish Case: If SHIB can chew through the 0.00003150 level, it might race towards the prized resistance at 0.00003300 and beyond, with a full-blown meme rally.
- Bearish Case: Failure to fetch new highs could result in SHIB taking a nap back in the comfy support zone of 0.00002850—or worse, marking territory below 0.00002750.
Shiba Inu Price Analysis: Conclusion
SHIB is behaving just like any good meme coin—erratic, volatile, and unpredictable. The next move could decide whether Shiba Inu gets a treat or a timeout. Watch that triangle pattern closely, as it might determine whether SHIB goes to the moon or gets stuck in the doghouse.
Until then, remember: even when Shiba Inu trades sideways, its meme value remains infinite. Keep those leash signals tight, and may the trading pups guide your trades!
- Chainlink Price Analysis – January 9, 2025: The Struggle for $20 and Beyond! - January 9, 2025
- 📊 Kekius Maximus Price Analysis – January 7, 2025 🎭 - January 7, 2025
- 🚀 TON Price Prediction – January 6, 2025 📊🤖 - January 6, 2025


