Table of Contents
Ladies and gentlemen, crypto enthusiasts, and degenerate traders, welcome to yet another episode of “Chart or Dartboard?” where we attempt to decode what TON (Telegram Open Network) is whispering to us through its price chart. 🧠📉 Grab your caffeinated beverages because it’s time to dive into this triangular spectacle.

📈 Chart Overview:
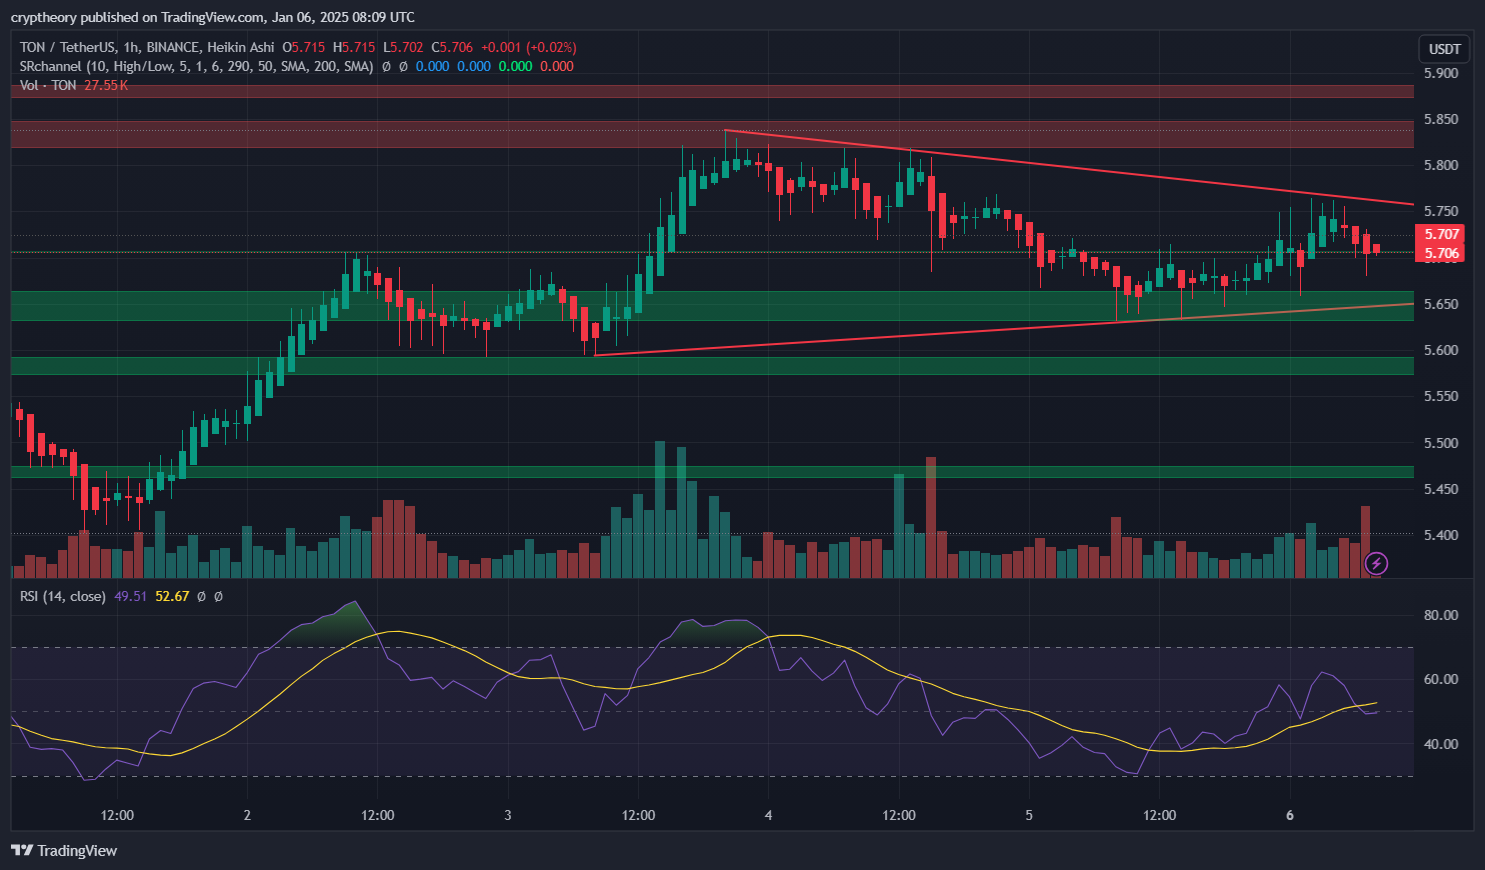
The TON/USDT pair on the 1-hour timeframe looks like it’s trapped in a sandwich – squeezed tighter than a day-one intern at a corporate meeting. We’re observing a symmetrical triangle pattern, which basically means the price is having an existential crisis about whether to moon or dive into the crypto abyss.
Current Price: $5.706
Change: +0.02% (Clearly, TON doesn’t believe in big moves today)
🟢 Support & Resistance Levels:
- Immediate Support: $5.65 – A comfy floor where bulls are currently camping.
- Secondary Support: $5.55 – If the floor breaks, this is where bulls will likely set up their emergency tents.
- Immediate Resistance: $5.75 – The ceiling TON keeps bumping its head against.
- Key Resistance Zone: $5.85–$5.90 – If we break this zone, confetti cannons will fire and Twitter will light up with rocket emojis.
📊 RSI and RSI-based MA Analysis:
- RSI (14, close): 49.51 – A classic “meh” zone. The RSI isn’t showing any strong bias, and it looks like it’s just chilling in the middle of the range.
- RSI-based MA: 52.67 – The RSI-based MA is slightly above RSI, which could signal mild bearish momentum, but nothing catastrophic… yet.
Translation? The bulls and bears are currently having a polite disagreement without throwing chairs.
📊 Volume Analysis:
Volume has been behaving like a teenager on a Monday morning – inconsistent and slightly grumpy. However, we did see some notable spikes recently, indicating that some whales (or slightly chunky dolphins) might be positioning themselves for a breakout.
Key Takeaway: If volume spikes at the triangle breakout point, expect fireworks.

1. Bollinger Bands Analysis (BB 20, SMA, close, 2):
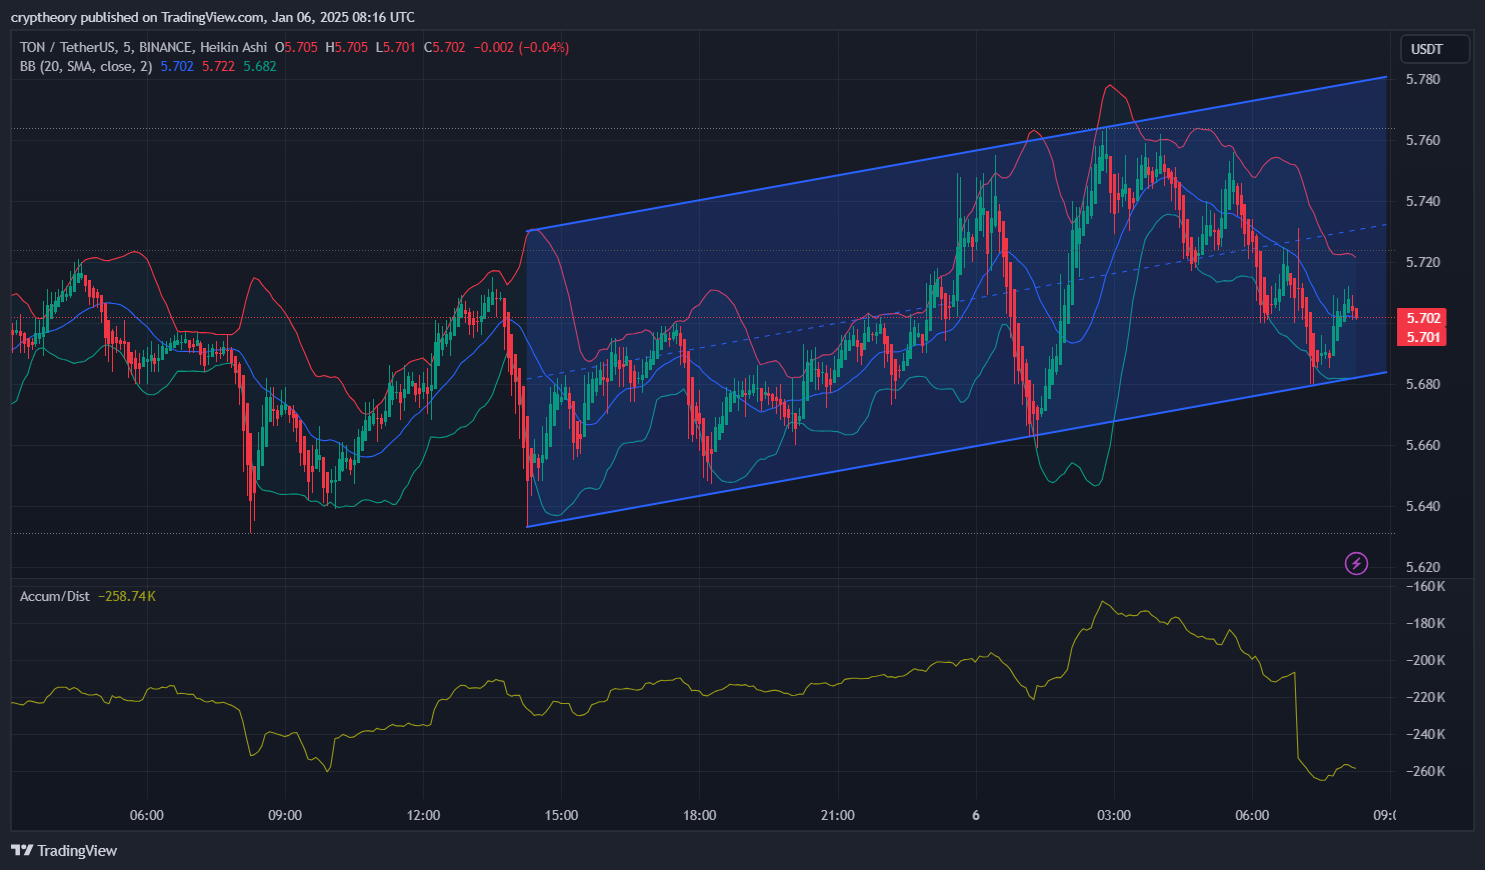
- Upper Band: 5.722
- Middle (SMA): 5.702
- Lower Band: 5.682
Interpretation:
The price is currently hugging the middle band (SMA), which suggests mild consolidation. The price recently touched the upper band and pulled back, signaling overbought conditions and a natural retracement. The lower band is acting as dynamic support, while the upper band provides dynamic resistance. If the price breaks below the middle band, it may retest the lower Bollinger band.
2. Accumulation/Distribution (Accum/Dist):
- Current Accum/Dist Value: -258.74K
Interpretation:
The negative Accum/Dist value indicates a recent selling pressure and possible distribution phase. The indicator is trending downward, reflecting that sellers currently have the upper hand. However, if Accum/Dist starts to reverse and trend upward, it could signal fresh buying activity.
3. Technical Evaluation:
- The chart shows an ascending channel with price oscillating between the upper and lower trendlines.
- The price recently tested the upper boundary of the channel but failed to break out, leading to a pullback.
- Bollinger Bands suggest a period of mild volatility with price hovering near the middle band.
- The downward trajectory in the Accum/Dist indicator aligns with the recent pullback, indicating some profit-taking or distribution.
📌 Key Takeaways:
- Immediate Resistance: $5.722 (Upper Bollinger Band)
- Immediate Support: $5.682 (Lower Bollinger Band)
- Accum/Dist Trend: Negative, indicating distribution.
- Bollinger Bands Sentiment: Consolidation with mild bearish bias.
Recommendation: Traders should monitor the channel boundaries and the behavior of the Accum/Dist line. A breakout on either side of the ascending channel, combined with volume confirmation, will provide clearer direction for the next price move. 🚀📉
🚦 Scenarios to Watch:
🟢 Bullish Scenario:
- If TON breaks $5.75 with strong volume, we could see a sprint towards $5.85–$5.90, possibly even $6.00.
- The RSI will need to climb above 60 for this scenario to gain more credibility.
- A strong move above the upper Bollinger Band (5.722) would signal a breakout with a potential test of the $5.80 resistance level.
🔴 Bearish Scenario:
- If TON loses support at $5.65, brace for a potential drop to $5.55 or even $5.45.
- RSI dropping below 40 will be a big red flag.
- Continued downward movement in the Accum/Dist indicator would confirm bearish dominance.
🟡 Sideways Scenario (The Snoozefest):
- The price could stay locked between $5.65 and $5.75 for a while, annoying traders who are here for action.
🎯 TON Price Prediction – January 6, 2025: Final Thoughts
TON is currently like a cat stuck in a cardboard box – it’s ready to pounce, but we’re not sure whether it’s going for the treat or just deciding to sleep there indefinitely. 📦🐱
- For the Bulls: Keep an eye on $5.75. Breakout = Celebration time.
- For the Bears: Watch $5.65 closely. If it cracks, things could get spicy.
- For the Spectators: Popcorn is your best friend right now. 🍿
In conclusion, whether TON breaks up or down, one thing’s for sure – the triangle’s apex is near, and something big is coming. Buckle up, traders. 🚀📉
- 📊 Kekius Maximus Price Analysis – January 7, 2025 🎭 - January 7, 2025
- 🚀 TON Price Prediction – January 6, 2025 📊🤖 - January 6, 2025
- 🍪 Cookie DAO Price Prediction – January 3, 2025 🍪 - January 3, 2025


