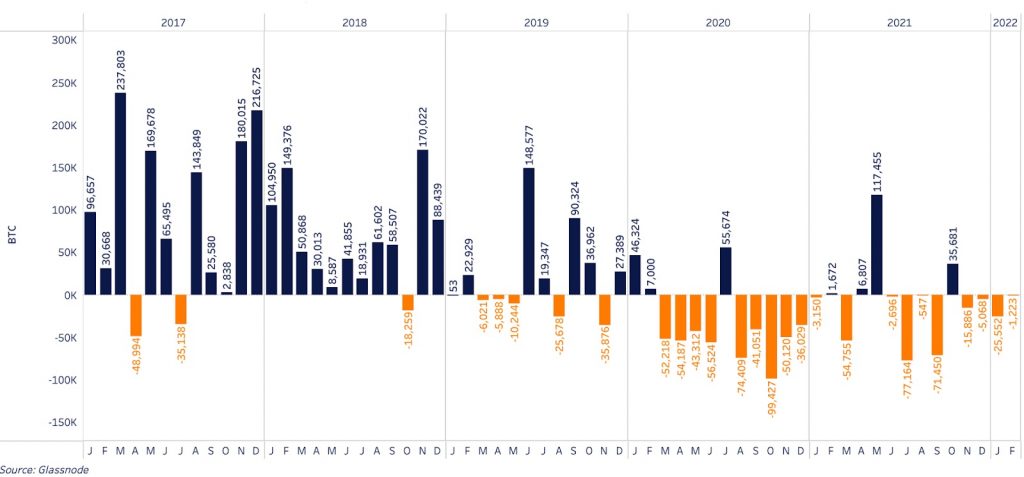
As we have mentioned many times, March 2020 was a strong catalyst and a turning point for BTC. This can be seen in the flow of BTC to exchange addresses, which have consistently shown net outflows over the last two years.
The last two periods of significant BTC market inflows took place just before the formation of the two recent BTC price peaks. These price highs in April and November 2021 coincided with the months of the net inflow of coins to the exchanges in March and October.
January was marked by the most significant net outflow since September 2021. The dynamics of BTC flows to exchange wallets help monitor changes in the general sentiment of market participants.
Over the last year, changes in the 90-day cumulative BTC inflow / outflow to exchanges have systematically coincided with price movements. In the chart below, the right axis is inverted to illustrate how the decline in net BTC inflows to exchanges correlates with rising prices and vice versa.
What we see in January is a reversal of the trend in the 90-day moving total, with more BTC leaving the exchanges than coming. This signals an increase in purchasing demand over the last month, and we can all see how the price has reacted to this in recent days. This comes amid renewed accumulation in the last few weeks by long-term holders and whales.
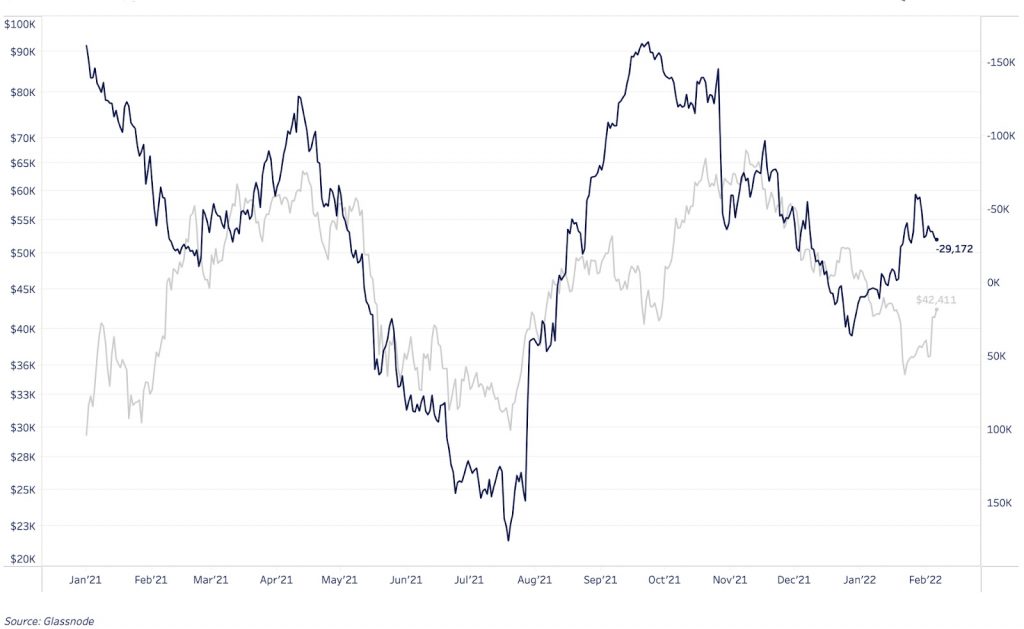
The right axis is inverted for clarity of illustration.
The 30-day change in exchange balances has slowed sharply over the last two weeks.

30-day BTC balance change (below).
Another way to look at the dynamics of changes in exchange balances is to estimate the ratio of the net inflow of coins to exchanges and the estimated adjusted BTC offer. The adjusted offer does not take into account coins that have not moved for the last 7 years – thus removing lost BTCs from the calculation. The current adjusted offer is about BTC 15.58 million, 82.2% of the total circulating supply.
When the net outflow of BTC from exchanges increases compared to the adjusted offer, it can serve as a short-term bullish signal for the price. When the net inflow of BTC to exchange increases compared to the adjusted offer, it can serve as a short-term bearish signal for the price. If we look at the last 30 days, we can see that on 27-28. January the ratio reached the zone of strong outflow:
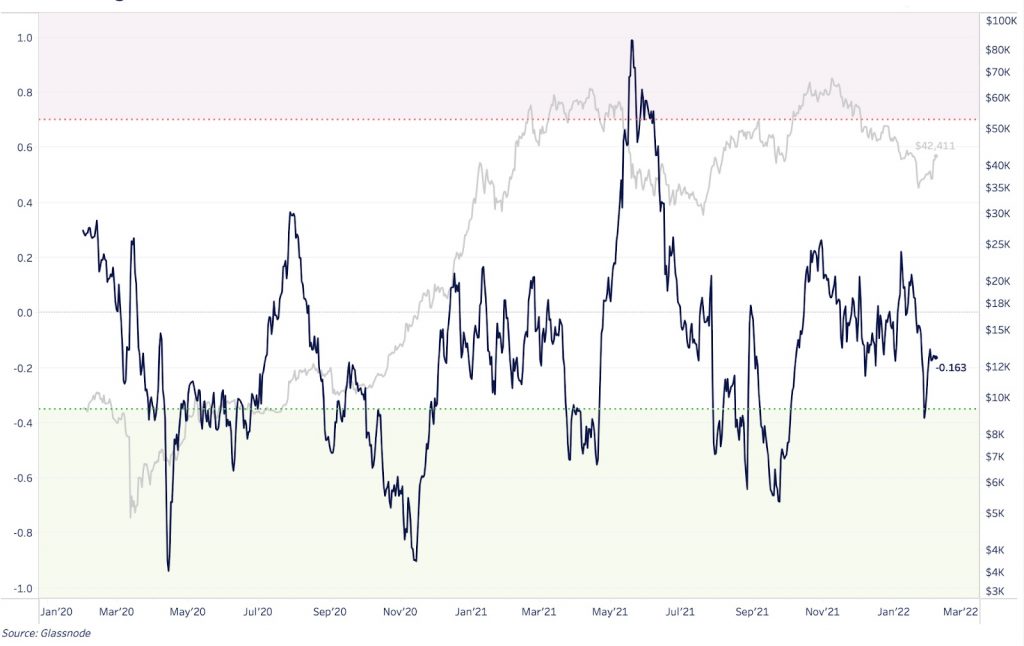
In the last two years, the price has not reacted to growth in the green zone only once in April 2021. At that time, the main driver of price growth was “overheated” derivatives markets, which later led to an increase in the decline due to cascading long liquidations. Today, however, the dynamics of the derivatives market is completely different: the market has a clear tendency to sell while the price rises, which means that the rebound from the January lows is mainly due to spot demand.
Updated data from the derivatives market
The position of derivatives traders is a key factor for short-term movements in the BTC market. BTC rose above $ 40,000 on Saturday, but traders’ bearish positions in perpetual swaps still persisted, with funding remaining negative despite a 25% jump in prices. At the time of writing, BTC is trading at approximately $ 44,000 and the funding rate is still negative, which means that sellers are paying buyers for the right to keep their positions open.
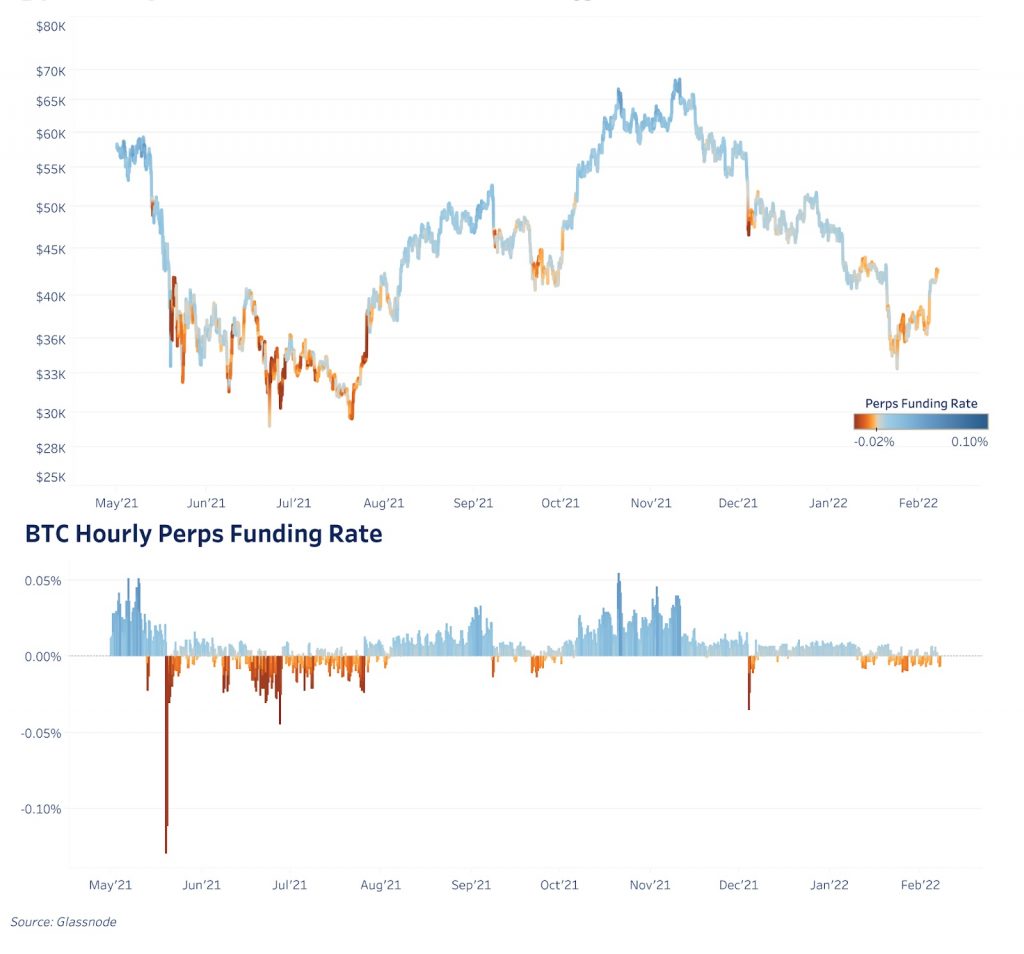
BTC perpetual futures per hour (below) funding rate.
In the last 24 hours of the perpetual futures market, BTC sellers have paid buyers an average of about 3.3% per annum of the nominal size of the position, which the bulls have failed to take advantage of.

hourly open interest (below).
Open interest in the perpetual futures market remains high, and therefore a significant number of current sellers will become forced buyers if sustained spot demand is maintained (which appears to be the main driver of growth from local January lows).
Ledger Nano X Review and Where to Buy Nano X (2022)
- What Could Bitcoin’s Price Be in 25 Years? A Lambo or Just a Latte?” 🚀💸 - December 23, 2024
- Solana Price Analysis – December 18, 2024: The Slippery Slope of SOL 🚀📉 - December 18, 2024
- Bitcoin Price Analysis – 16/12/2024: A Dance in the Ascending Channel - December 16, 2024

