Table of Contents
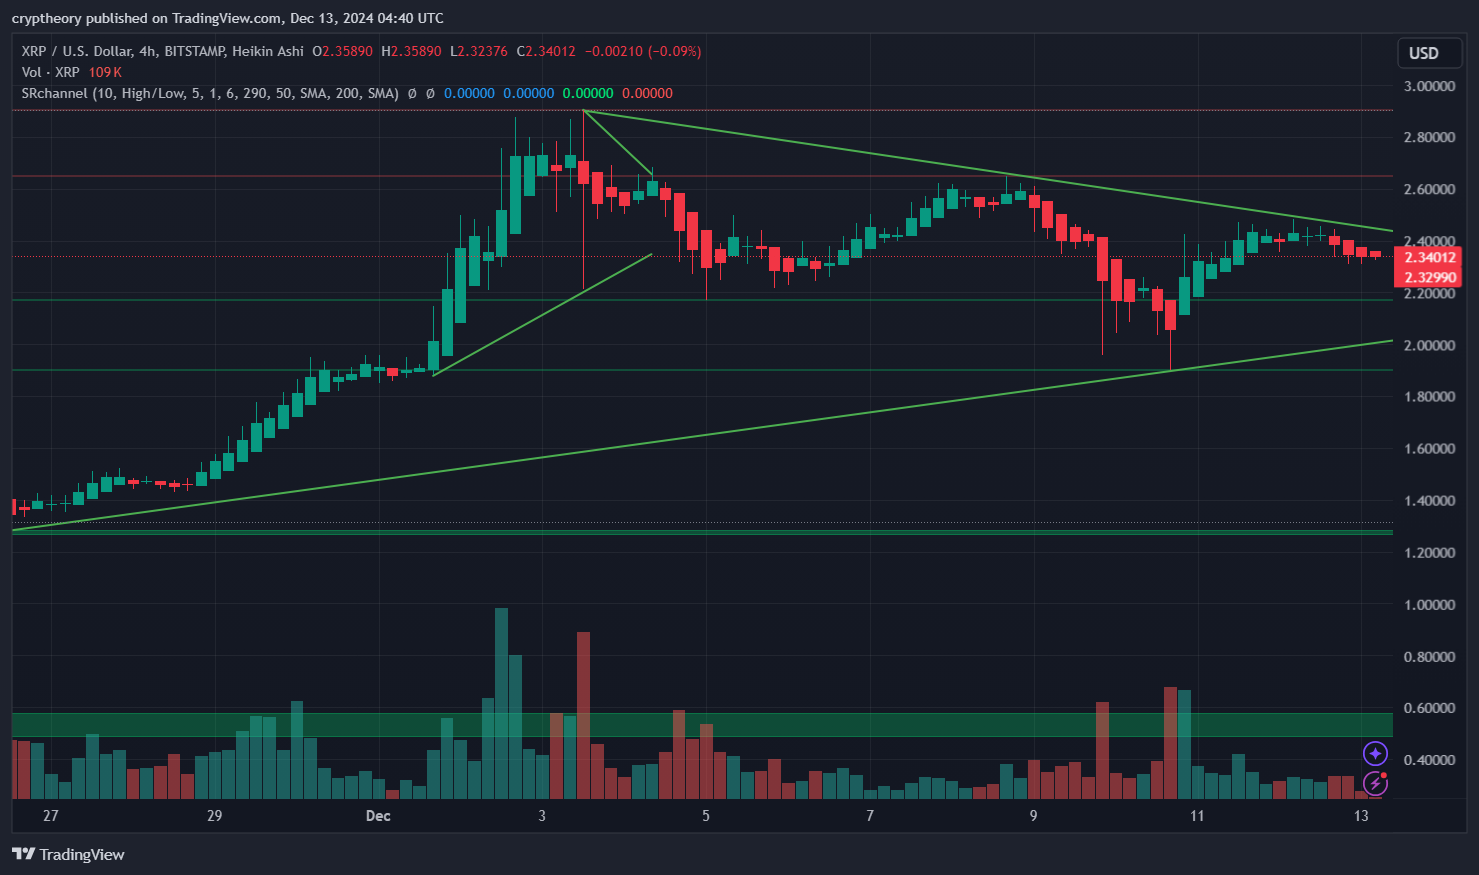
Ladies, gentlemen, and crypto enthusiasts, XRP is currently dancing in what can only be described as the “Triangle Tango.” The 4-hour chart shows XRP priced at $2.34, moving hesitantly within the narrowing bounds of a symmetrical triangle. Bulls and bears are squaring off in a classic showdown, while the market holds its breath for a dramatic breakout or a crushing breakdown. Grab your popcorn—this is going to be a thrilling ride.

Resistance Zones: The Bears’ Guardposts
- $2.50: The first real challenge. This resistance has been as stubborn as a toddler refusing to eat their vegetables.
- $2.75: If the bulls muster enough energy to breach $2.50, this is their next battleground.
- $3.00: The psychological level that every XRP holder dreams of seeing again. Breaking this would send XRP moon-bound—maybe not all the way to Saturn, but at least to the Moon’s orbit.
Support Levels: The Bulls’ Fortress
- $2.20: Acting as a soft cushion, this level has saved XRP from a free fall multiple times.
- $2.00: A psychological level that screams “Danger Zone!” but also offers a strong foundation if tested.
- $1.80: If XRP falls this far, prepare to hear the collective groan of disappointed traders.
Symmetrical Triangle: Who Will Blink First?
The symmetrical triangle is tightening like a noose, leaving XRP no choice but to pick a direction soon. Historically, triangles are like coin flips—you can’t predict which way the market will go, but you know it’s going to go fast. Bulls are hoping for a breakout above $2.50, while the bears are sharpening their claws for a dive below $2.20.
Volume Analysis: The Calm Before the Storm
Volume has been steadily declining, signaling that traders are sitting on the sidelines, waiting for XRP to make up its mind. However, the volume spikes on December 3rd and December 9th suggest there’s plenty of pent-up energy waiting to explode. Whether it will fuel a bullish rally or a bearish collapse is the million-dollar question.
What the Indicators Are Whispering
- Moving Averages (SMA 50 & 200): The price is hovering around its short-term moving averages, a sign of indecision. The longer-term trend still leans bullish but is losing momentum.
- Volume Oscillator: Falling volume confirms market consolidation. Expect fireworks once this breaks.
- Symmetry Suggestion: The triangle’s apex indicates a breakout decision within the next few sessions.

RSI (Relative Strength Index):
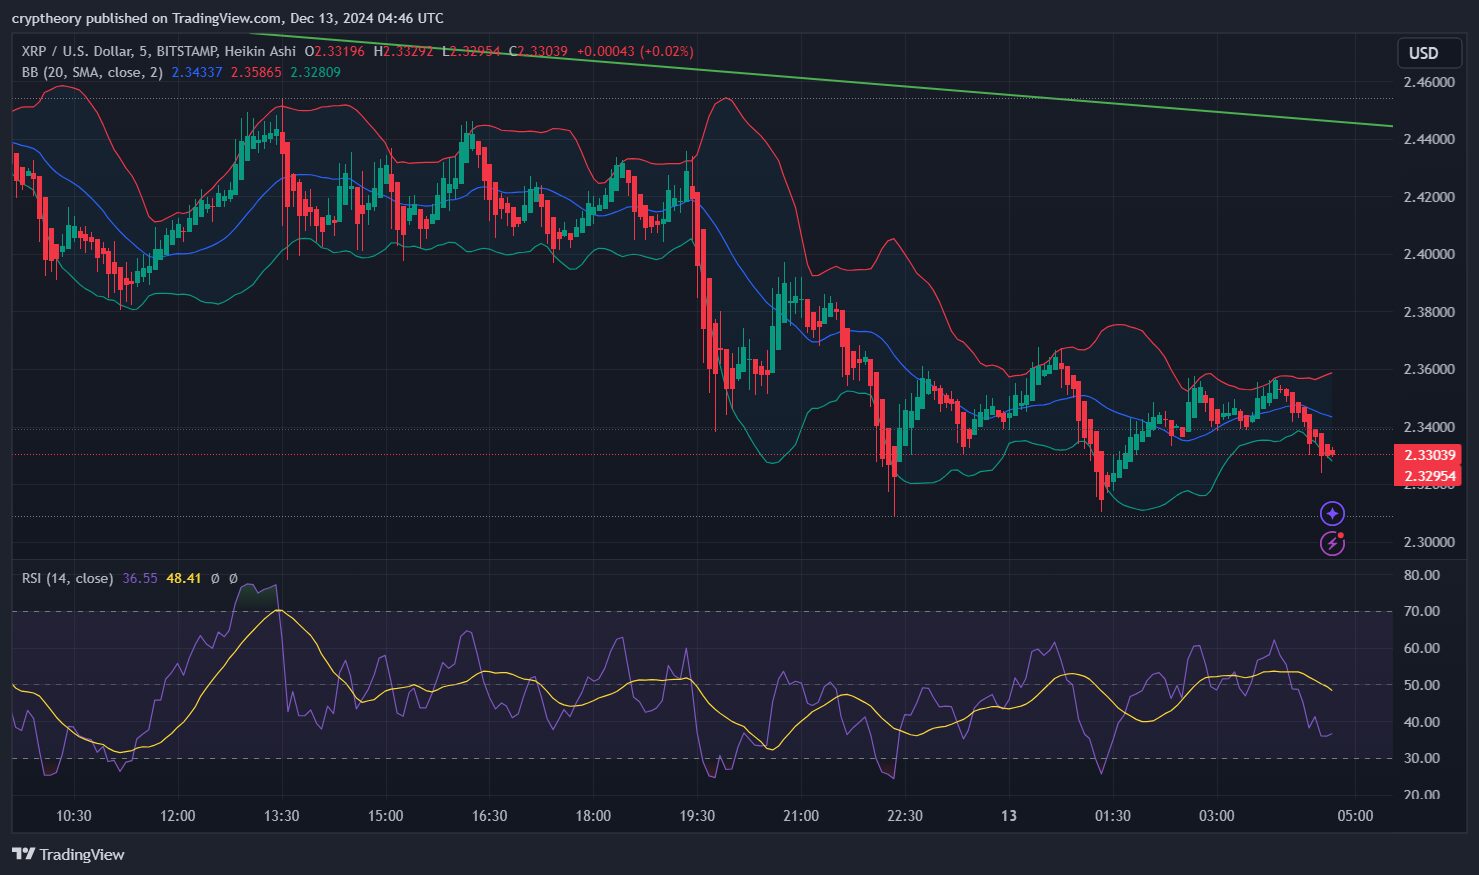
- Current RSI (14): The value is 36.55, indicating the market is nearing oversold territory but hasn’t hit extreme levels yet.
- Trend: The RSI shows a declining trend, reflecting weakening momentum and increased selling pressure.
RSI-based Moving Average:
- RSI MA Value: The RSI-based moving average is at 48.41, showing the RSI is currently below its average. This indicates a bearish momentum shift in the short term.
- Interpretation: RSI falling below its MA suggests continued weakness unless there’s a reversal soon.
Bollinger Bands:
- Middle Band (SMA 20): 2.34337 USD, which serves as the average price and a potential pivot point for the next move.
- Upper Band: 2.35865 USD, acting as short-term resistance.
- Lower Band: 2.32809 USD, acting as immediate support.
- Band Width: The bands are relatively narrow, signaling low volatility and the possibility of an upcoming breakout.
Summary:
- RSI Analysis: With RSI approaching oversold levels, the market may be preparing for a potential bounce, but current momentum favors the bears.
- Bollinger Bands Analysis: Price is nearing the lower Bollinger Band, suggesting a possible support level or oversold condition in the short term.
- Overall Outlook: The market is consolidating with bearish undertones. Watch for a bounce from the lower Bollinger Band or further declines if RSI dips deeper into oversold territory.
Bullish Scenario: To Infinity (Or $3.00, At Least)
If the bulls can gather enough strength to break above $2.50, it could trigger a wave of FOMO (fear of missing out). In this scenario:
- Immediate Target: $2.75
- Stretch Target: $3.00
- Moon Target: $3.50 (Hey, one can dream, right?)
Bearish Scenario: Back to Earth
Should the bears overpower the bulls, a breakdown below $2.20 could lead to a slide down to $2.00 or worse:
- Immediate Target: $2.00
- Freefall Zone: $1.80
- Nightmare Scenario: Sub-$1.50 (Let’s not go there, for the sake of XRP believers.)
XRP Price Analysis: The Triangle Tango Final Thoughts
XRP’s current price action is like watching a suspense thriller—every move keeps you on the edge of your seat. With the symmetrical triangle pointing to an imminent breakout, the market is gearing up for a decisive move. Will XRP rise like a phoenix or tumble like a house of cards? Only time will tell. For now, keep your eyes on the volume and those key levels. And remember, the market never fails to surprise us when we least expect it!
- A Look Back at Bitcoin’s Historic Year 2024: From ETFs to New All-Time Highs - December 31, 2024
- Ethereum Price Could Skyrocket in 2025: Here’s What Experts Expect 🚀📊 - December 31, 2024
- How Trump’s Politics Could Send Ethereum to the Moon—Or Just to Mar-a-Lago? - December 30, 2024


