Table of Contents
Ah, XRP—the wild card of the crypto jungle, where the charts look like they’re running a marathon while juggling flaming torches. Let’s break down today’s circus act based on the provided chart, shall we?
Price Action: A Day at the Amusement Park
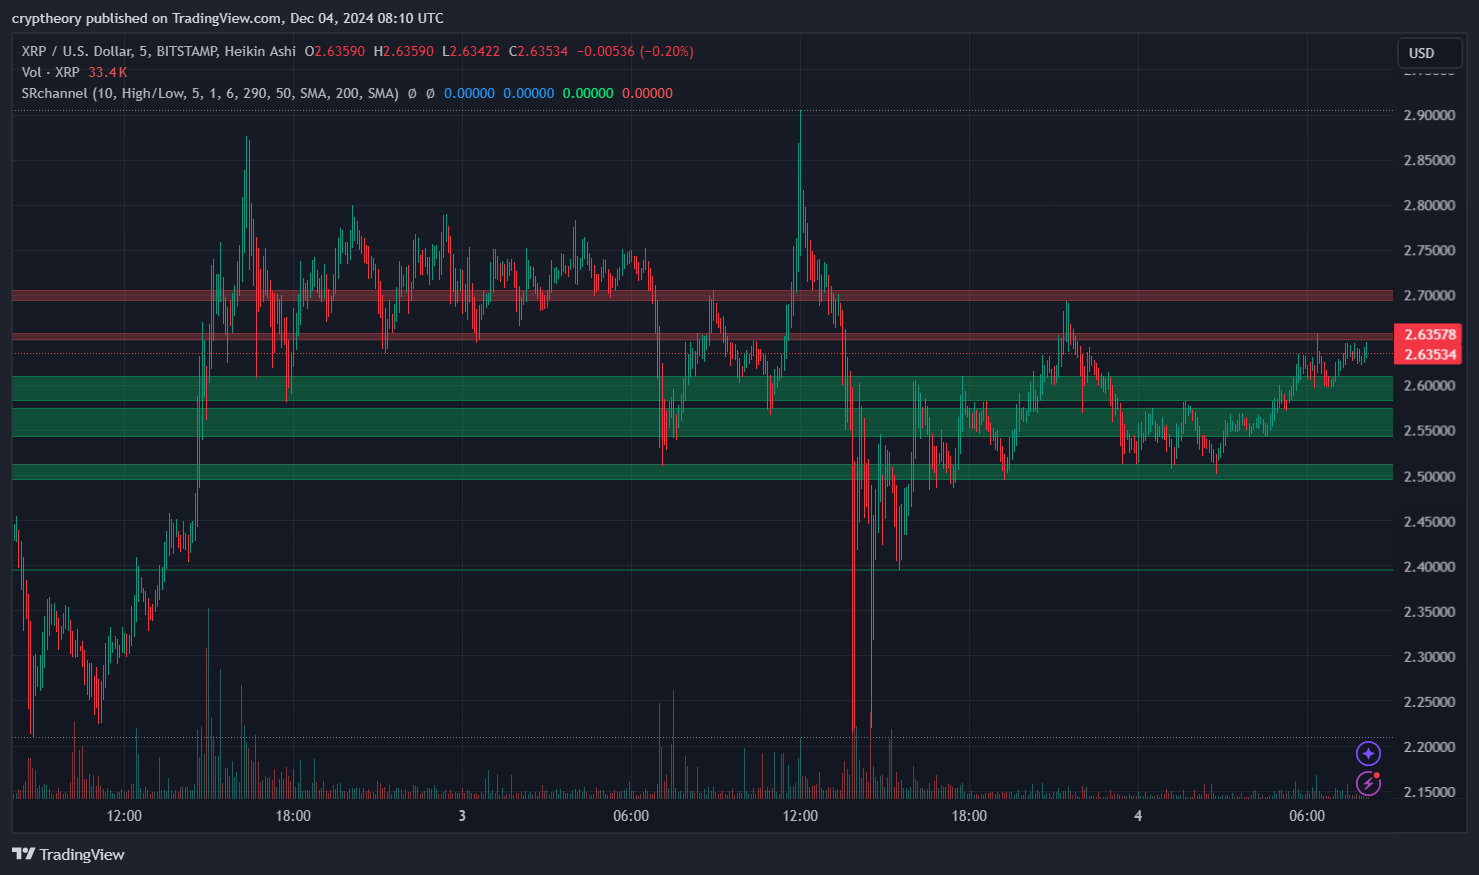
The show opens with XRP testing the $2.40 support level, a green zone that might as well be labeled “The Safe Zone.” This area is like the comfy couch you go back to after every misadventure. Buyers kept pushing the price upward from here, as if XRP was refusing to let the floor turn into quicksand.
Then came the breakout—XRP soared past $2.60, roaring like a roller coaster heading for the first drop. Just when you thought the momentum would carry it to the moon, reality hit at the $2.70 resistance level, aka “The Big Red Wall.” It’s as if XRP ran into an invisible barrier made of bad vibes and sell orders. The price wobbled, fell, and tumbled like a drunk trapeze artist.
Support & Resistance: The Battlefields
- Green Zones (Support): XRP fans have fortified these levels, especially between $2.40-$2.55. This area is practically an XRP fan club rally, where buyers chant, “Not today, bears!”
- Red Zones (Resistance): Up top, at $2.70, bears have built a fortress. Every time XRP approaches, it’s like a battle of memes—bulls post “Diamond Hands” while bears shout, “It’s a scam!” Guess who’s winning for now?
Heikin Ashi Candles: Smooth Operators
This chart uses Heikin Ashi candles, a type of candlestick that’s so smooth it should be sponsored by skincare companies. These candles are filtering out the noise, but even they can’t hide XRP’s erratic attempts to break resistance. Right now, they suggest a cautiously bullish trend, though bulls seem to be walking on eggshells.
Trading Volume: The Whispering Crowd
Volume is not exactly screaming, but it’s definitely not silent either. Think of it like a crowd at a mid-tier football match—some enthusiasm but not enough to fill the whole stadium. The volumes around the $2.65 level indicate indecision, as if traders can’t decide whether XRP is a hidden gem or just fool’s gold.
Forecast
- If XRP breaks $2.70, expect traders to celebrate like they’ve just found free Wi-Fi. Targets of $2.80 and beyond could come into play.
- If it gets rejected (again), it might slump back to $2.50, muttering, “I’ll be back” in a Terminator voice.
- A drop below $2.40, however, might send XRP diving into $2.20 territory, where hodlers start panicking and Googling “how to stay calm in crypto.”
Relative Strength Index (RSI)
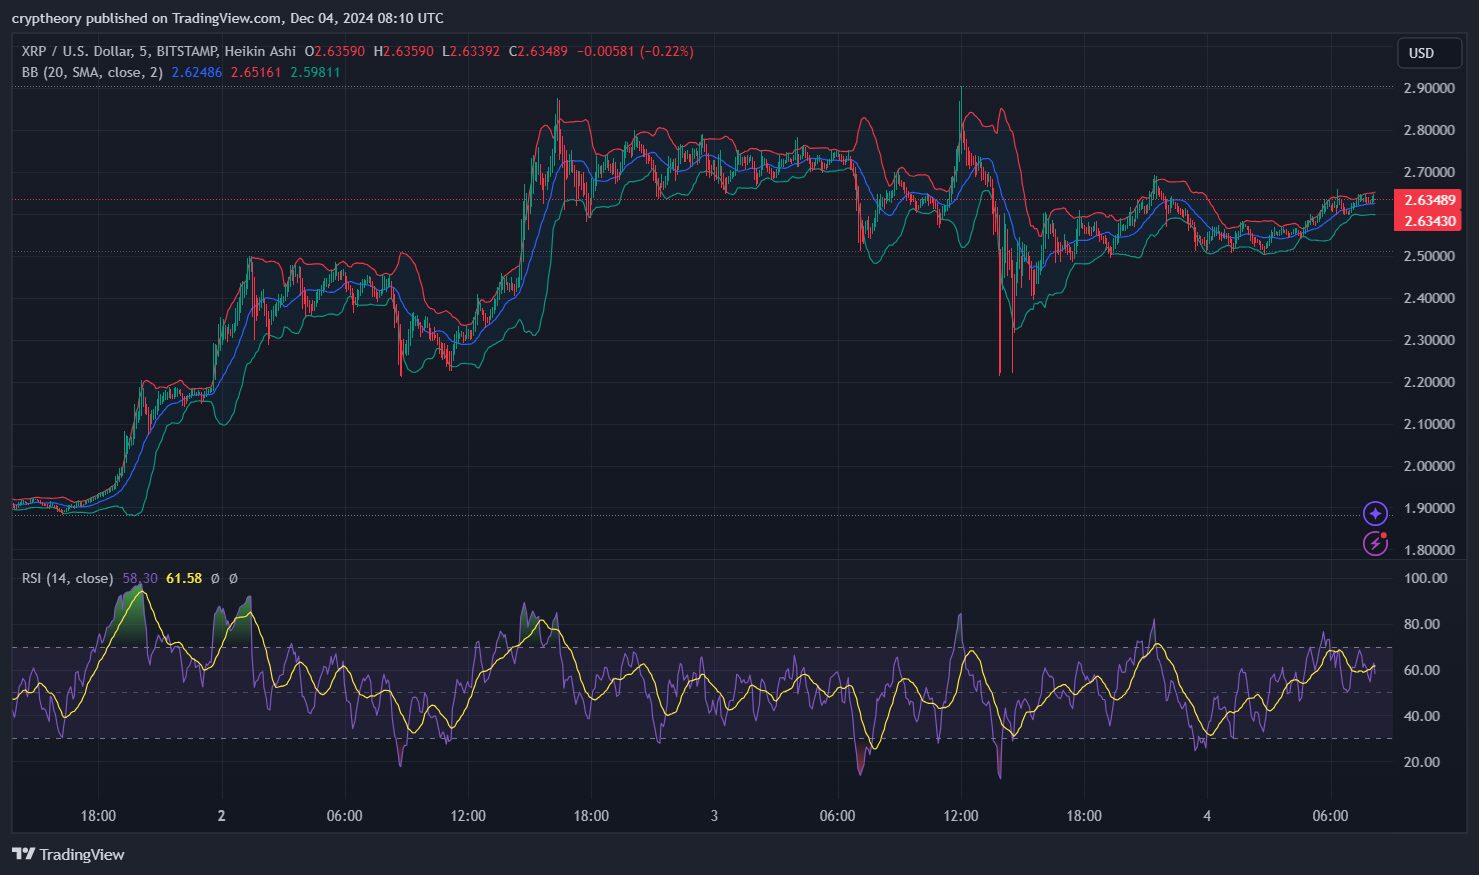
- Current RSI Value: The RSI is hovering around 61.58, suggesting bullish momentum, but it’s not in overbought territory yet. It indicates moderate strength for buyers.
- Overbought/Oversold Levels:
- Overbought threshold: 70 (not reached yet).
- Oversold threshold: 30 (far from this level).
- Recent RSI Behavior:
- RSI peaked above 70 briefly (overbought) during the strong rally towards $2.70 but has since cooled down.
- Dips below 50 (neutral zone) earlier coincided with support levels around $2.40, signaling buying opportunities.
RSI-Based Moving Average
- The RSI-based Moving Average (MA) is acting as a smoother trend indicator.
- RSI MA Value: Approximately 58.30, confirming slight bullish bias.
- RSI has crossed above its moving average, signaling the continuation of an upward trend unless it reverts back below the MA.
Bollinger Bands
- Setup: The Bollinger Bands (20-period SMA with a 2-standard deviation width) indicate current price volatility.
- Upper Band: $2.65 — XRP is flirting with this level but hasn’t yet broken through decisively. A breakout above this suggests further upward momentum.
- Lower Band: $2.59 — This acts as immediate support during price retracements.
- Middle Band (SMA): $2.62 — The price has been consistently oscillating around this level, reflecting consolidation after volatility spikes.
- Band Width:
- Bands have tightened recently, signaling a period of reduced volatility. This compression often precedes a breakout, so traders should watch for significant moves soon.
Key Insights
- Bullish Signs:
- RSI above 60 suggests continued bullish momentum but with some caution due to proximity to resistance levels.
- Price approaching the upper Bollinger Band aligns with upward pressure.
- Neutral/Bearish Caution:
- If RSI drops below 50 or the price falls below the middle Bollinger Band, XRP could test $2.50 or the $2.40 support zone.
- Bollinger Band tightening suggests a breakout is imminent—direction depends on whether XRP breaks above resistance at $2.70 or falls below $2.60.
This analysis indicates that XRP is currently in a consolidation phase with bullish potential, but careful observation of RSI levels and Bollinger Band breakout points is crucial for traders planning their next move.
Conclusion
In summary, XRP is putting on quite the drama today. Bulls and bears are in an arm-wrestling match, and the $2.70 level is the trophy. Will XRP climb over its resistance and flex its bullish muscles, or will it tumble back to the safety of support zones? Only time—and perhaps the next tweet from Elon Musk—will tell.
Until then, buckle up, traders. XRP is as unpredictable as a cat in a room full of laser pointers.
- 🍪 Cookie DAO Price Prediction – January 3, 2025 🍪 - January 3, 2025
- Virtual Protocol Price Analysis – January 2, 2025 - January 2, 2025
- 🚀 Bitcoin Price Analysis – December 31, 2024: “Sliding into the New Year with Style (and Volatility)” 🎢 - December 31, 2024


