Table of Contents
Alright, let’s dive into the world of XRP and its illustrious journey through the perilous battlefield of support and resistance zones, captured in this colorful price action story on November 2, 2024. Drumroll, please…
The Tale of XRP: A Hero’s Journey Through the Land of Heikin Ashi
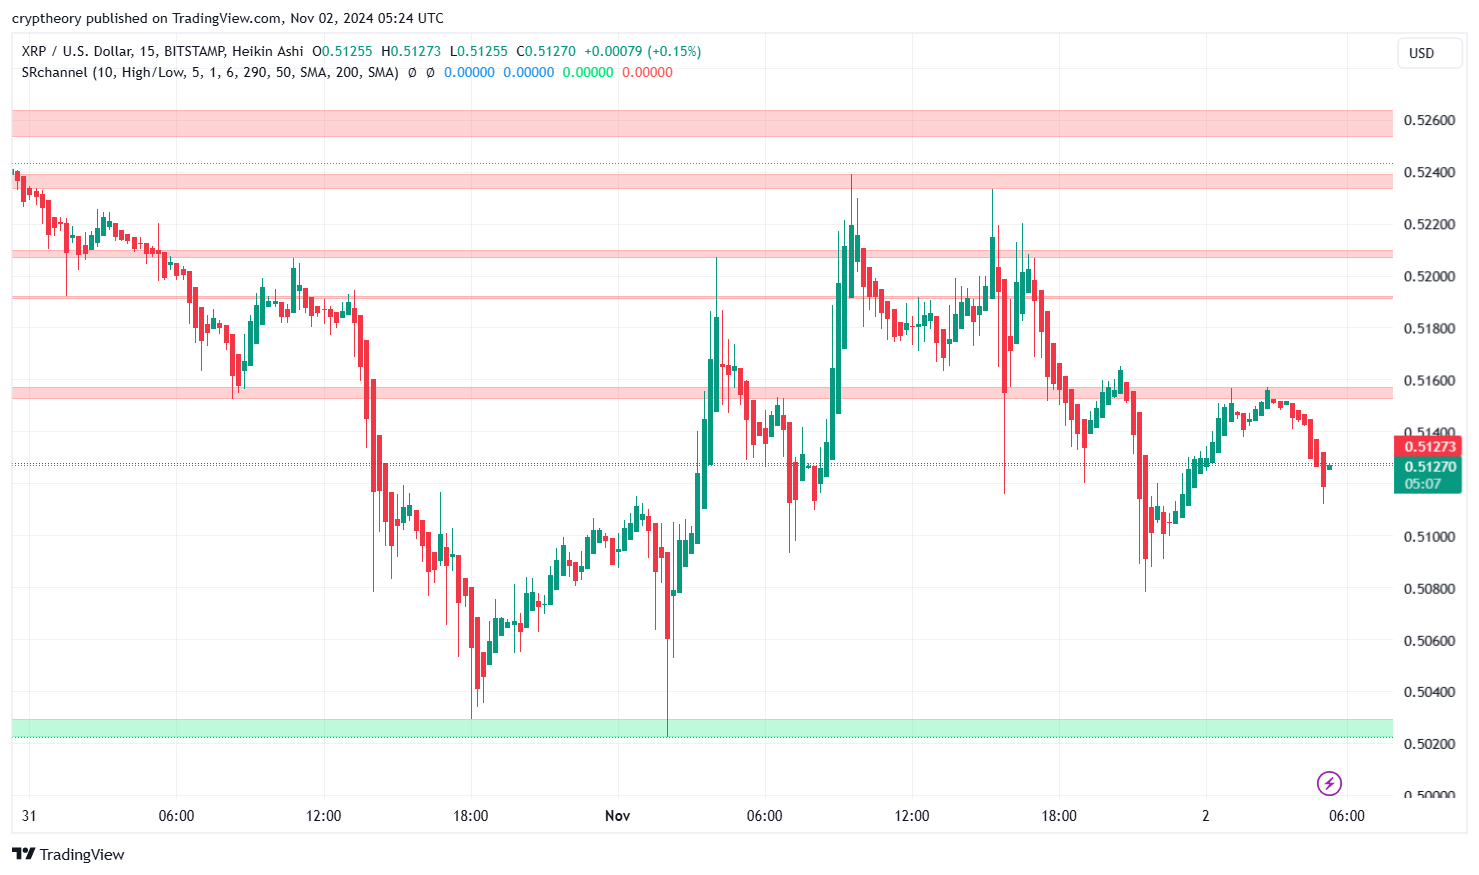
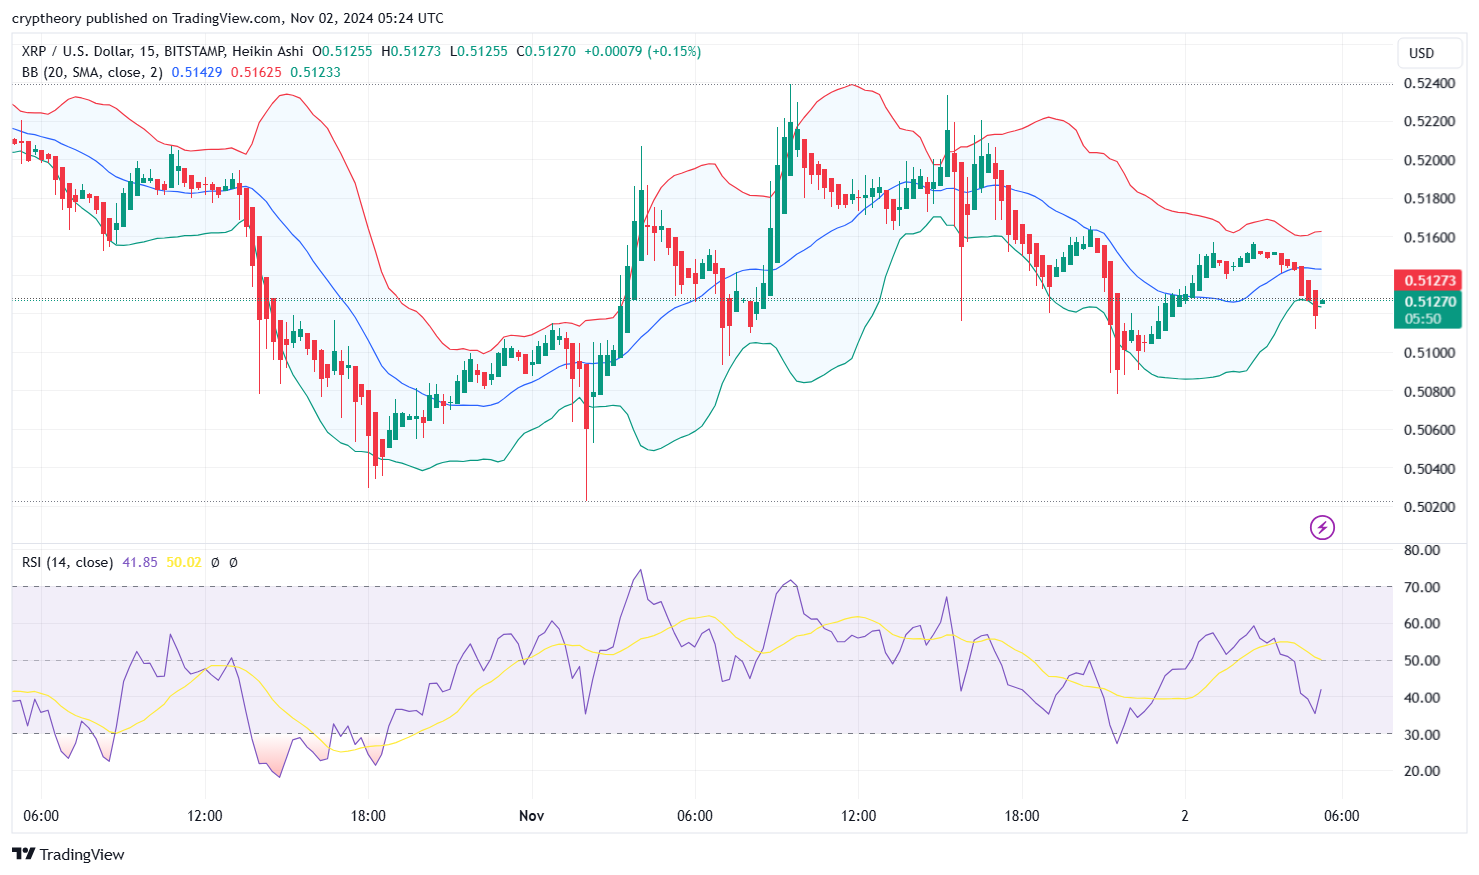
Our protagonist, XRP, starts its epic quest somewhere in the mythical land of $0.51. Look closely, and you’ll see the XRP price maneuvering like an adventurer on a treacherous path — Heikin Ashi candles in hand, battling through the zones colored in that haunting shade of red. These zones aren’t just any ordinary obstacles; they’re formidable bands of resistance, each one more challenging than the last.
The Early Hours: The Bearish Abyss
The journey begins in dark times. XRP descends into the Bearish Abyss, breaking past multiple levels of red resistance, showing little mercy. This part of the chart might as well have a narrator saying, “And so, the brave XRP descended, meeting every green candle’s optimism with a swift rejection.”
But, alas! Around the bottom — near the $0.5040 zone, marked in green — there is a glimmer of hope. This area, our Support Sanctum, acts like a magical healing fountain for the weary XRP. Here, our hero catches its breath, readying itself for a comeback.
The Mighty Rebound: Bulls Strike Back
And then, the plot thickens! XRP starts to rally, climbing out of the Bearish Abyss like a phoenix rising from the ashes. The Heikin Ashi candles start turning green, signaling that the bulls have not yet abandoned the battle. XRP soldiers on, storming upward, smashing through red zones of resistance with a renewed vigor, reaching up to the daunting $0.5180 and $0.5200 levels.
For a brief, glorious moment, it seems like nothing can stop XRP. It’s like a trading montage from an action movie where every red level is punched through in slow motion, with the audience cheering. But just when you think it’ll hit the high heavens, XRP starts to falter…
The Resistance Strongholds: A New Challenge
At around $0.5220, XRP encounters the legendary Resistance Strongholds. These aren’t just any ordinary levels. They’re the final boss in this price action saga. After several attempts to break through, each one brimming with optimism (look at those tall wicks!), XRP finally starts to lose steam. It’s as if the bears set up a laser grid defense system at these levels — every time XRP tries to breach it, it gets zapped back down.
This mighty struggle rages for hours, with bulls and bears locked in an epic tug-of-war, until finally, XRP is exhausted. The green candles become shorter, and the red candles regain control. Our hero, having tasted victory for but a fleeting moment, begins to descend once more.
The Present Moment: Contemplating the Next Move
And so, here we are, on November 2, 2024. XRP currently sits at a slightly nervous $0.5127, right in the middle of familiar territory. The green Support Sanctum below offers some comfort, but the Resistance Strongholds above loom like a cloud of doom. At this point, XRP seems to be in introspective mode, caught in an existential crisis. Will it make another attempt to reach the higher resistance levels? Or will it retreat back into the warm embrace of the green support zone below?
Technical Takeaways
- Support and Resistance Zones: XRP has been channeling between strong support around $0.5040 and resistance near $0.5220. These levels are like invisible walls — as soon as XRP touches them, the candles reverse.
- Heikin Ashi Insights: The red Heikin Ashi candles show the strong downward momentum XRP faced, while the green ones indicate brief moments of bullish optimism. But each optimistic wave seems shorter, suggesting the bulls might be getting tired.
- Trading Psychology: If XRP were a person, it would be having an “I think I can” moment, only to realize halfway up that it’s more “I think I almost could.” The battle between bulls and bears here is fierce, but neither side has a decisive upper hand.
- Volatility Expectation: Given the current position near mid-range support, expect some sideways action before another dramatic move. Either XRP finds the courage to rally again, or it might just end up back at the bottom support.
The Verdict: To Moon or Not to Moon?
Will XRP ascend to the promised land beyond $0.5220? Or will it return to lick its wounds at the green support below? Only time will tell, but one thing is certain: in the grand saga of XRP price action, this chart has just penned a dramatic chapter.
So, brave traders, keep your eyes peeled, for this tale is far from over. And remember, as always, in the land of trading, “resistance is futile… unless it isn’t.”
RSI and RSI-based Moving Average
- RSI (14): Currently, the RSI value is around 41.85, indicating that XRP is in the lower range but not yet oversold. This level suggests weak momentum, leaning towards bearish sentiment, though it remains above the oversold threshold (below 30).
- RSI Moving Average: The yellow RSI-based moving average is around 50.02, sitting close to the neutral midpoint. This indicates that although there is some downward pressure, the overall trend is not decisively in oversold or overbought territory.
Bollinger Bands
- Upper Band: Approximately $0.51625, representing a resistance point where XRP might struggle to break if it continues upward.
- Middle Band (SMA): Around $0.51429, serving as a central pivot point. XRP has been trading near or slightly below this middle band, suggesting it is in a consolidation phase or slightly bearish.
- Lower Band: Roughly $0.51233, acting as a nearby support level. If XRP continues to descend, it might find temporary stability around this level.
Overall XRP price analysis on November 2, 2024
The RSI indicates mild bearish momentum without a clear oversold signal, while the Bollinger Bands show a relatively narrow range, signaling low volatility at the moment. If XRP stays near the lower band, there could be a potential bounce back toward the middle band, but breaking above the upper band may require stronger bullish momentum.
- You may also like: What is XRP, price prediction 2024 – 2030, and why to invest
- What Could Bitcoin’s Price Be in 25 Years? A Lambo or Just a Latte?” 🚀💸 - December 23, 2024
- Solana Price Analysis – December 18, 2024: The Slippery Slope of SOL 🚀📉 - December 18, 2024
- Bitcoin Price Analysis – 16/12/2024: A Dance in the Ascending Channel - December 16, 2024


