Table of Contents
Ah, XRP, the digital asset that never fails to keep traders on their toes. November 15, 2024, saw XRP on a quest for higher highs, dancing its way through support and resistance levels like a blockchain ballerina. Let’s dive into this humdrum day turned exciting rally and see what the chart is telling us.
Act I: The Warm-Up – Building Momentum at $0.74
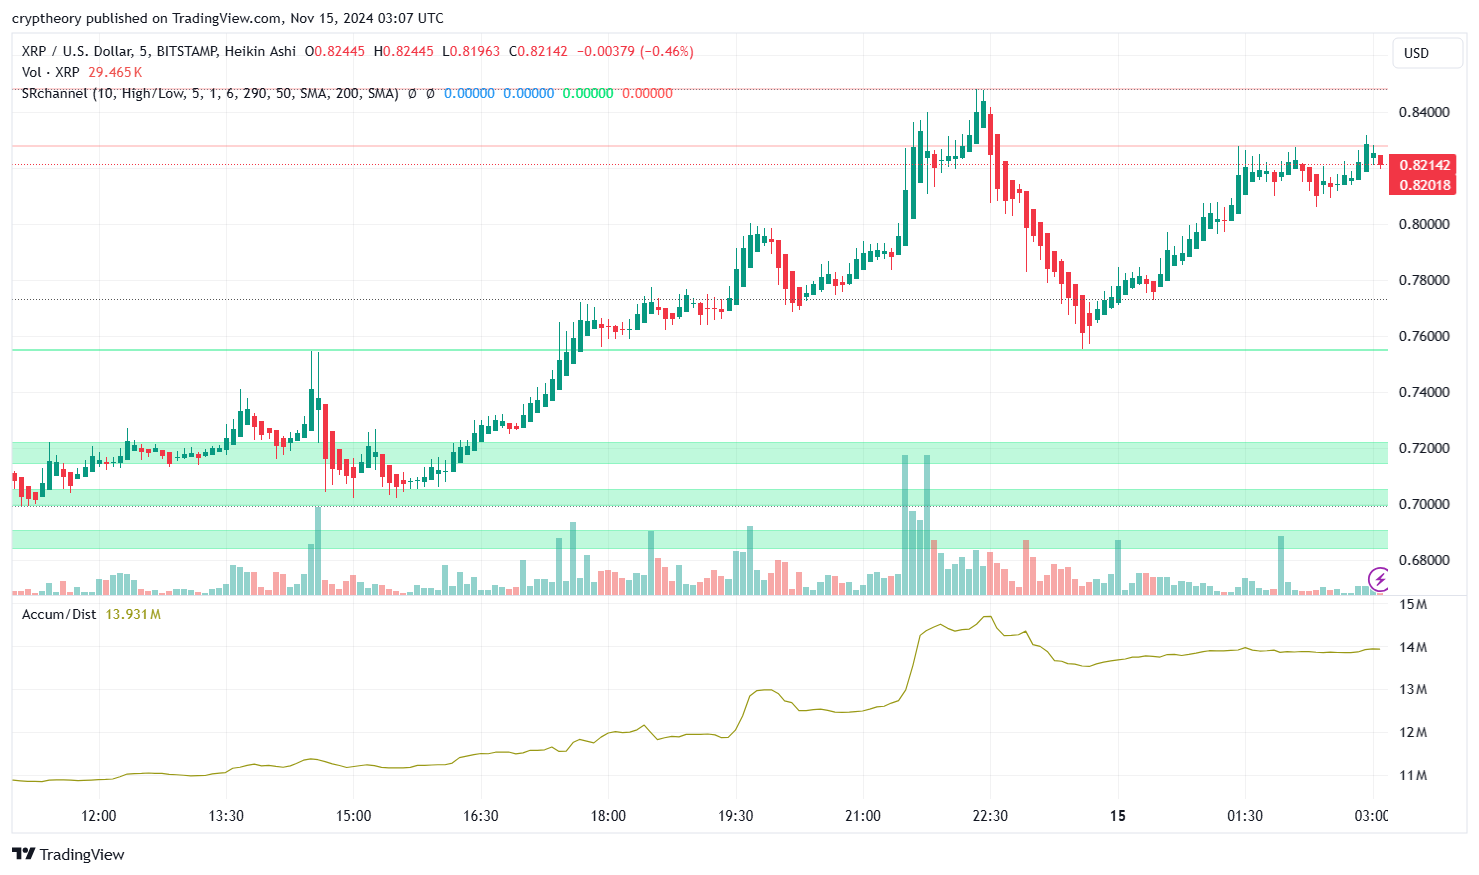
XRP started the day in the lower range, bouncing off a solid support zone around $0.74. This level proved to be a fortress, deflecting bearish attempts to push the price down. The volume was steady but unremarkable until mid-afternoon when things started heating up.
As the Accumulation/Distribution indicator ticked upward, savvy traders could sense that demand was building. Could it be that XRP was preparing for a sprint? Spoiler alert: Yes.
Act II: The Breakout – Straight to $0.84
The real fun began as XRP broke past the $0.78-$0.80 resistance zone with conviction. Fueled by rising buying pressure and a noticeable spike in trading volume, XRP shot up like it had a jetpack strapped to its back. It peaked at $0.84, a level that sent ripple effects (pun intended) through the crypto community.
The green support zones on the chart now act as safety nets, with traders eyeing $0.80 as the key level to hold. A failure to do so could send XRP tumbling back to the $0.74 range, but let’s not spoil the fun yet.
Act III: The Retracement – Taking a Breather
Every good rally needs a cooldown, and XRP is no exception. After hitting $0.84, sellers stepped in to cash out, leading to a slight pullback to the $0.82-$0.83 range. The market seems to have entered a consolidation phase, as the price is now bouncing between these levels.
The Accumulation/Distribution indicator, which climbed impressively during the rally, suggests that demand remains strong. But will buyers step in to push the price higher, or are we in for a quiet evening?
Technical Analysis: What’s Next for XRP?
- Support Levels:
- $0.80 – Key immediate support, a break below could lead to $0.74.
- $0.74 – Strong secondary support, proven to hold firm earlier in the day.
- Resistance Levels:
- $0.84 – Immediate resistance, needs to be cleared for another leg up.
- $0.87 – A potential next target if bullish momentum continues.
- Indicators:
- Accumulation/Distribution: Indicates strong demand, suggesting bulls are still interested.
- Volume: Spiked during the breakout, but tapering off in consolidation.
Relative Strength Index (RSI)
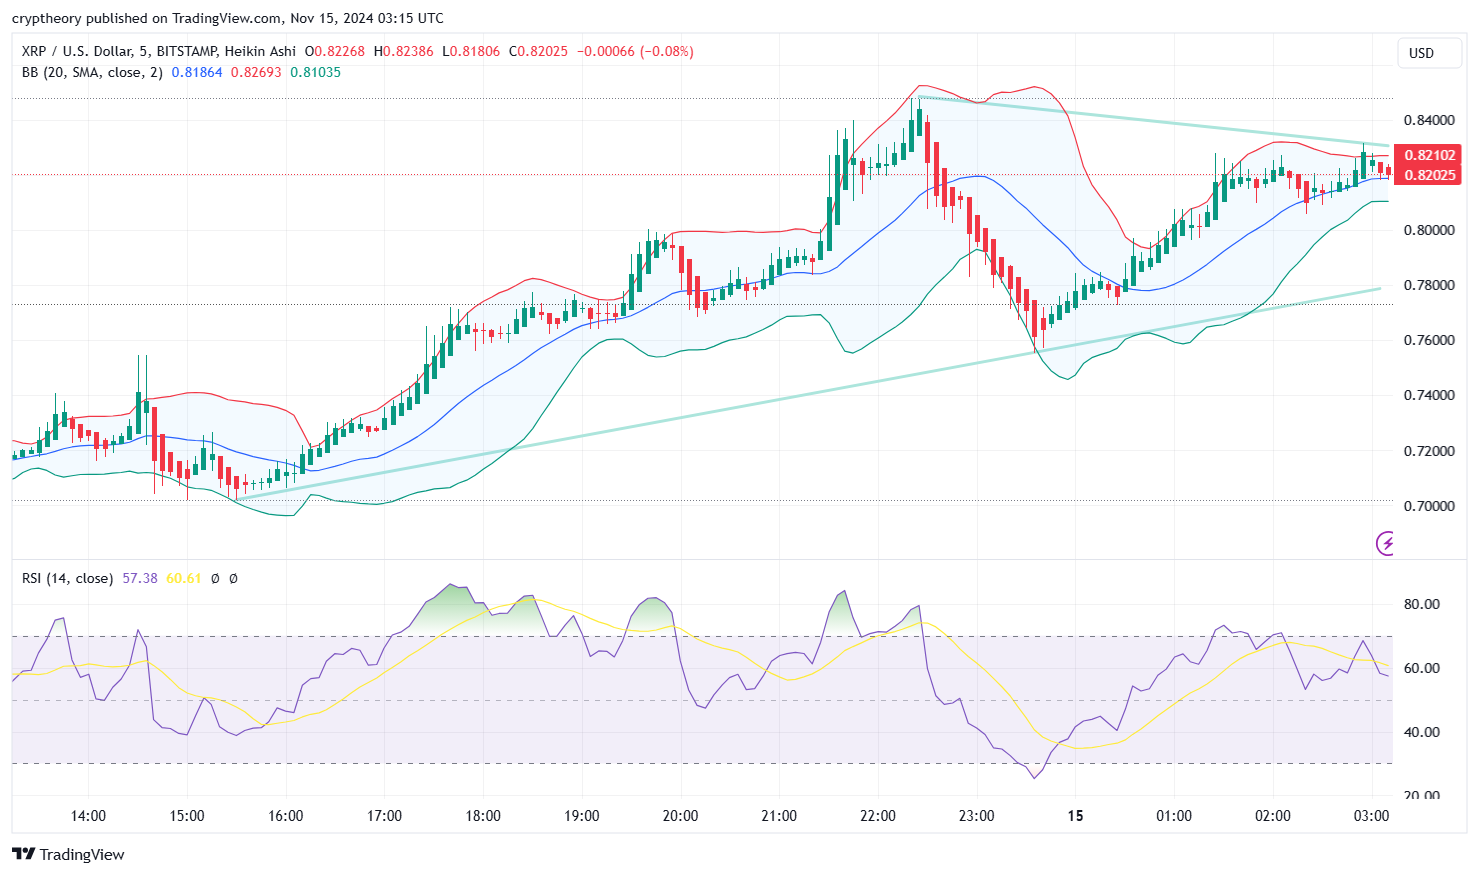
- Current RSI Value: 57.38
- The RSI is in the neutral-to-bullish zone, indicating a slight advantage for buyers over sellers.
- This suggests XRP is experiencing a healthy trend with room for further upward movement before hitting overbought conditions (RSI above 70).
- RSI-Based Moving Average: 60.61
- The RSI moving average is slightly higher than the current RSI, signaling a potential cooling-off period as buyers take a breather.
- However, the RSI remains above 50, reflecting a generally positive sentiment.
Bollinger Bands
- Current Bollinger Band Levels:
- Upper Band: $0.82693
- Middle Band (SMA): $0.81864
- Lower Band: $0.81035
- Price Position:
- XRP is trading near the upper Bollinger Band, indicating strong buying pressure. However, being close to the upper band could suggest the price is slightly stretched and might consolidate or retrace.
- Volatility:
- The bands are widening, reflecting increased volatility as XRP attempts to break higher.
Trendline and Technical Evaluation
- Trendline Support:
- The ascending trendline shows consistent higher lows, demonstrating a bullish structure.
- As long as XRP holds above $0.81, the uptrend remains intact.
- Triangle Formation:
- A symmetrical triangle pattern is forming, with a potential breakout approaching as the price converges near the apex.
- Breakouts from such formations often lead to significant price movements in the breakout direction.
Market Interpretation
- Bullish Scenario:
- A breakout above the $0.83 resistance could propel XRP toward the $0.85-$0.87 range, depending on sustained buying pressure.
- Rising volume and RSI breaking above 60 would confirm bullish momentum.
- Bearish Scenario:
- If XRP fails to hold above the $0.81 middle Bollinger Band or breaches the trendline, the next support lies at $0.78-$0.80.
Conclusion: The chart reflects a market leaning bullish but nearing a critical decision point. XRP’s ability to maintain its position near the upper Bollinger Band and break out of the triangle pattern will dictate its next move. Traders should watch the RSI and volume closely, as a surge in either could signal the direction of the breakout. For now, XRP continues to tread the line between consolidation and continuation, leaving the door open for both opportunity and caution.
Conclusion: XRP’s Next Move
XRP’s journey today has been a testament to its volatility and the market’s excitement around this asset. With the price consolidating around $0.82, the stage is set for either a push to $0.87 or a retreat to retest $0.80.
The question now is: Will XRP find enough momentum to break past resistance, or will it take a breather? One thing’s for sure—whether you’re a hodler or a day trader, XRP never lets you rest easy. Stay tuned for the next episode of the Ripple Chronicles!
- What Could Bitcoin’s Price Be in 25 Years? A Lambo or Just a Latte?” 🚀💸 - December 23, 2024
- Solana Price Analysis – December 18, 2024: The Slippery Slope of SOL 🚀📉 - December 18, 2024
- Bitcoin Price Analysis – 16/12/2024: A Dance in the Ascending Channel - December 16, 2024


