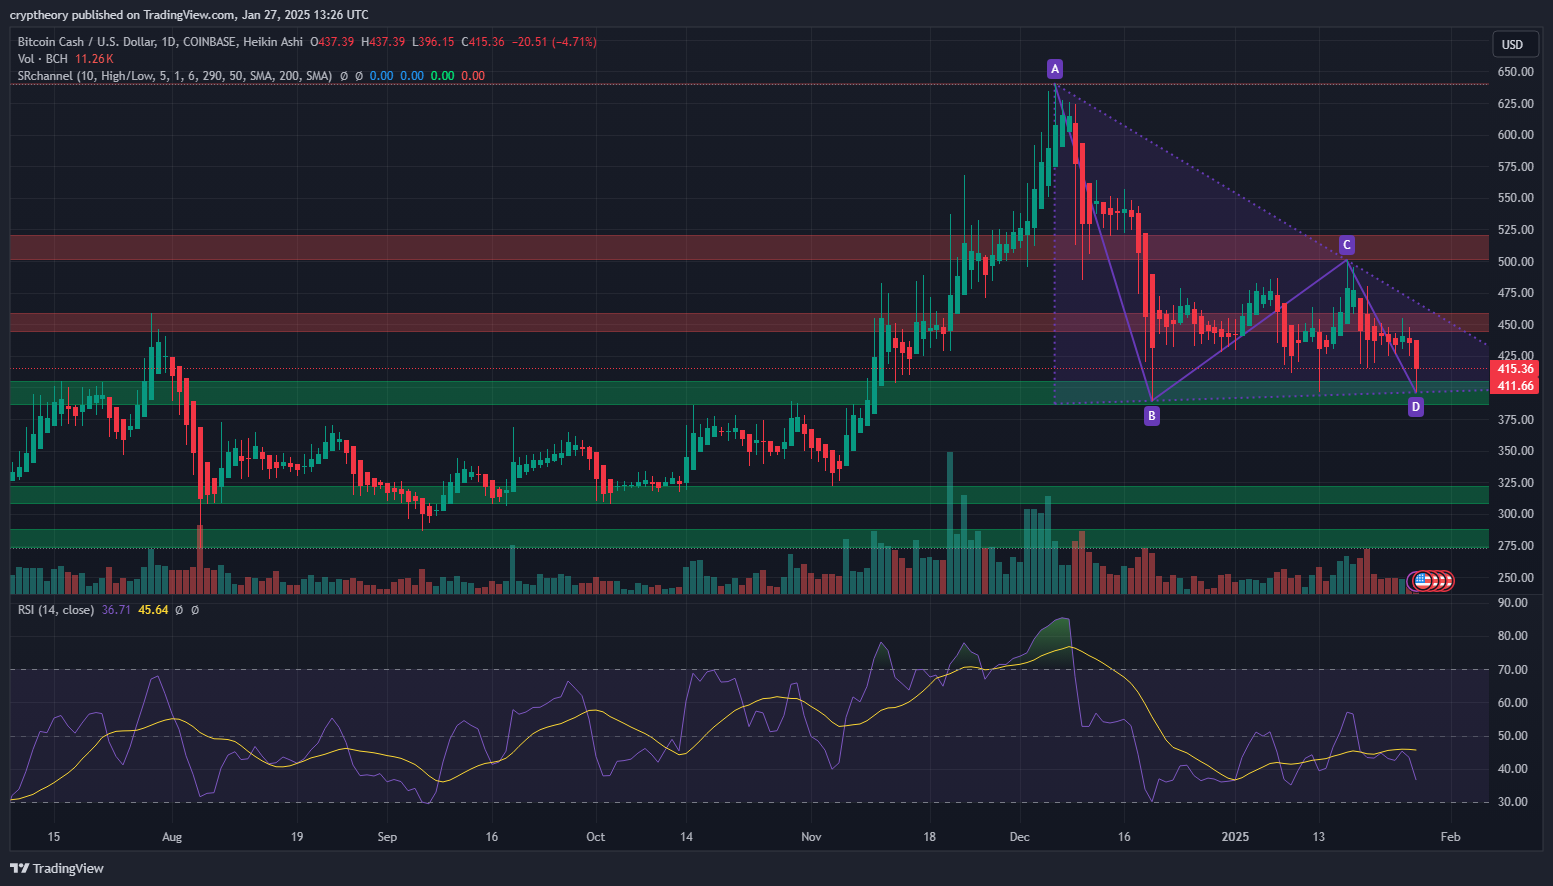
Key Market Data
- Current Price: $415.36 (-4.71%)
- Daily High/Low: $437.39 / $396.15
- Trading Volume: 11.26K BCH
- Key Indicators:
- RSI (14): 36 (Approaching Oversold)
- Moving Averages: BCH is trading below the 50, 100, and 200 SMAs (Bearish Signal)
- Harmonic Pattern: Suggests a potential price reaction at the current level
Technical Analysis – Support & Resistance Levels
BCH is currently trading near a major demand zone, which has acted as a strong support level in the past. If this level holds, we could see a bullish reversal, but a breakdown would open the door for more losses.
Resistance Zones (Where Sellers Are Active)
- $450 – $475 → A previous local high and now acting as strong resistance.
- $500 – $525 → A major supply zone from the last bullish rally.
- $600+ → A psychological resistance level that requires strong bullish momentum to break.
Support Zones (Where Buyers Might Step In)
- $410 – $375 → A critical support zone that BCH must hold to prevent further downside.
- $325 – $300 → A strong historical support level, tested multiple times before.
- $275 – $250 → An extreme support level, only likely to be tested in case of major market capitulation.
Potential Scenarios – What’s Next for BCH?
The price action of BCH suggests that we are at a turning point, and the next move will be critical in determining whether the price rebounds or continues downward. Here are the three most probable scenarios.
Bullish Scenario (30% Probability)
- BCH finds strong support at $410 – $375 and begins to recover.
- A break above $450 could trigger a bullish rally toward $500 – $525.
- RSI moves above 40, indicating a shift in momentum from bearish to bullish.
Short-term Bullish Target: $450 – $475
Medium-term Target: $500 – $525
Neutral Scenario (40% Probability)
- BCH moves sideways between $410 – $450, forming a consolidation pattern.
- No strong breakout or breakdown; price remains in a range-bound market.
- Traders wait for a confirmed breakout or breakdown before taking action.
Range to Watch: $410 – $450
Bearish Scenario (30% Probability)
- BCH breaks below the $410 support level, leading to further downside.
- The price declines to $375 and could even drop to $325 – $300.
- RSI enters oversold territory (<30), which could indicate panic selling.
Short-term Bear Target: $375
Extended Bear Target: $325 – $300
Trading Strategy & Tips
Given the current uncertainty in BCH’s price action, traders should follow a clear strategy to maximize potential gains and minimize risk. Below are trading strategies for both bullish and bearish setups.
Bullish Entry Strategy (Long Trade)
A bullish strategy works best if BCH confirms a breakout above resistance or finds strong support at the current level.
- Entry Point: Buy BCH above $450, confirming bullish momentum.
- Stop Loss: Place a stop below $410 to protect against a fake breakout.
- Profit Targets:
- 🎯 First Target: $475
- 🎯 Second Target: $500 – $525
✅ Confirmation Signals:
- Price reclaims 50-day SMA (~$450-$460)
- RSI moves above 50, showing renewed bullish strength
- Volume increases on green candles
Bearish Entry Strategy (Short Trade)
If BCH fails to hold support and breaks below $410, a bearish setup would be ideal.
- Entry Point: Sell BCH if it breaks below $410 with strong volume.
- Stop Loss: Place a stop above $425 to protect against short squeezes.
- Profit Targets:
- 🎯 First Target: $375
- 🎯 Second Target: $325
✅ Confirmation Signals:
- Price fails to hold $410 support
- RSI drops below 30, indicating continued selling pressure
- Volume spikes on red candles
Risk Management Tips
Risk management is crucial in volatile markets, especially when trading cryptocurrencies.
- Always use a stop loss – Avoid getting caught in extreme volatility.
- Don’t FOMO – Wait for confirmation before entering a trade.
- Manage position size – Risk only 1-2% of your capital per trade.
- Watch for Bitcoin correlation – BCH often follows BTC’s movement.
Final Thoughts – Will BCH Bounce or Drop Further?
Bitcoin Cash is at a critical juncture, and the $410 support zone will determine its next move. If BCH can hold this level, a bullish reversal toward $450+ is possible. However, if the price breaks below support, we could see a drop toward $375 – $325 in the coming days.
📌 Key Levels to Watch:
- Bullish Breakout Above: $450 → Targeting $500 – $525
- Bearish Breakdown Below: $410 → Targeting $375 – $325
Traders should stay cautious, monitor key levels, and watch for confirmation signals before making any major moves. The next few days will be crucial for BCH’s trend direction, so keep an eye on volume, RSI, and Bitcoin’s movement.
🚀 Stay disciplined, trade smart, and follow the trend! 🔥
If you want to track your portfolio or receive alerts on your favorite coin, you can use our Portfolio Checker and Coins Alerts tools for free! 🚀📊


