Table of Contents
Ladies and gentlemen, hodlers and panic sellers, grab your popcorn and fasten your seatbelts because Bitcoin is ending 2024 in true crypto fashion – unpredictable, dramatic, and just a little bit chaotic. Let’s dive into this financial rollercoaster together and see what’s cooking on the chart. Welcome to the latest bitcoin price analysis in 2024.

📊 The Chart at a Glance – Downtrend Chic 🛬
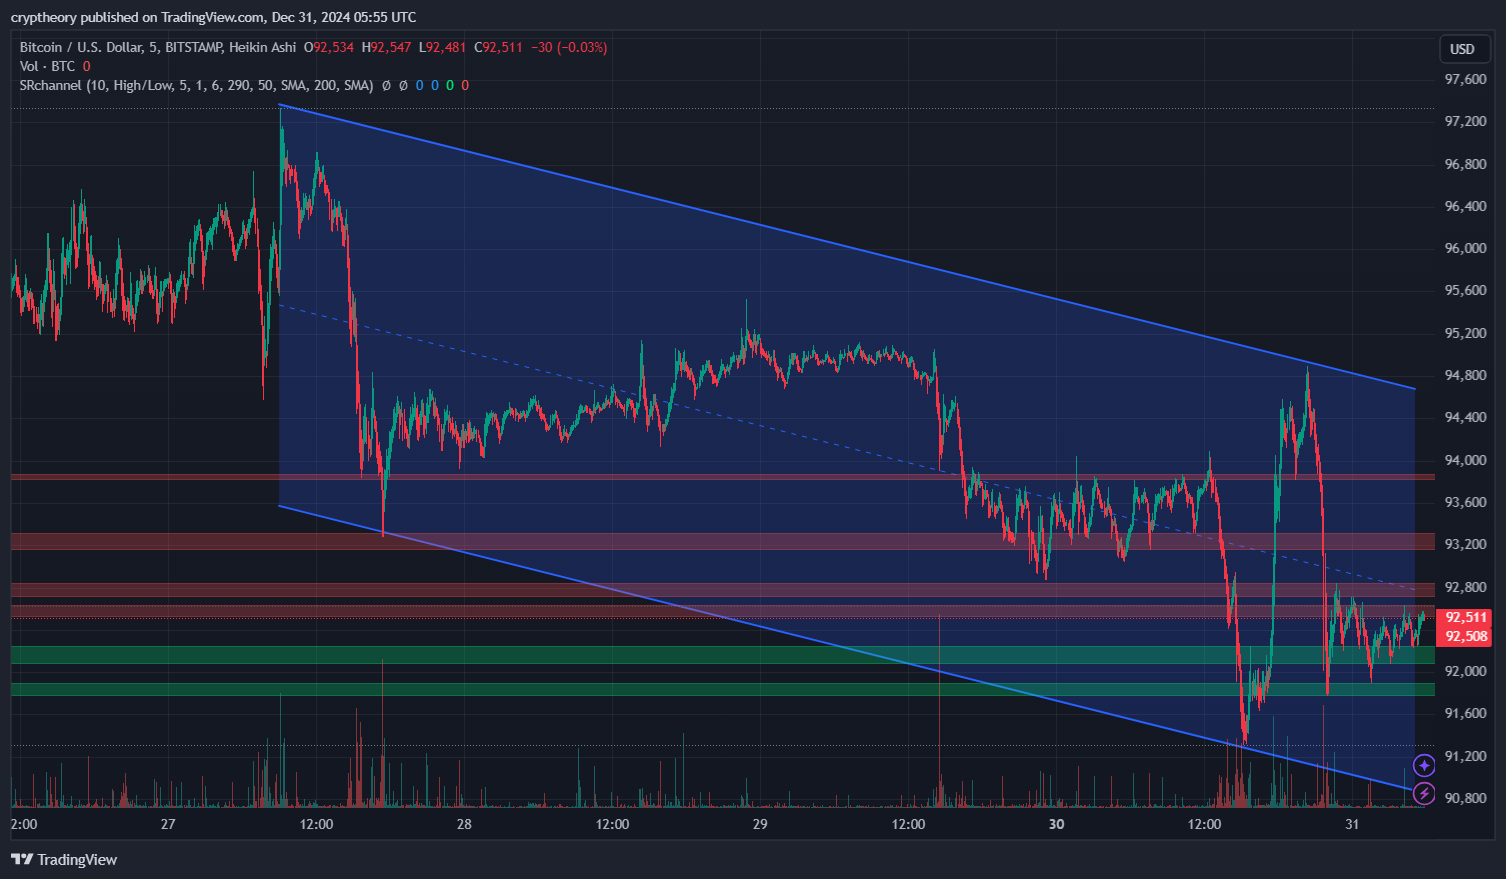
The chart looks like Bitcoin decided to wrap up the year by sliding down a giant blue waterslide. Yes, we’re in a descending channel, folks. You can almost hear Bitcoin whispering, “New Year, new me… but first, let me touch all these support levels on the way down.”
- Current Price: $92,511
- Resistance Zones: $93,200, $94,400
- Support Zones: $91,800, $91,200
Bitcoin seems to be enjoying the “Red Carpet” zone marked with resistance levels it couldn’t quite conquer, while lower support zones are waving nervously from below, hoping to catch our dear digital coin before it faceplants into oblivion.
📉 Downtrend Drama – Will Bitcoin Break Free?
We’ve been trapped in this descending channel for several days now. It’s like Bitcoin is on a never-ending elevator ride… going down. Every little spike upwards gets slapped down faster than you can say, “When moon?”
The upper trendline is acting like an overprotective parent: every time Bitcoin tries to sneak out to party above $94,500, it gets grounded and sent back to the couch.
The lower trendline, on the other hand, is trying its best to cushion Bitcoin’s falls. So far, it’s holding – but how long can it keep up?
📊 Volume Analysis – Ghost Town Trading 📉
Volume on this chart looks like everyone decided to take an early New Year’s vacation. Trading activity resembles a library rather than a battlefield, which explains why Bitcoin can’t decide whether to break resistance or collapse through support. The sudden green spikes are likely the whales shouting, “Surprise! Did you miss us?”
If we see a significant increase in volume, expect a breakout – whether up or down is the million-dollar question.

📊 Bitcoin Technical Indicators Overview
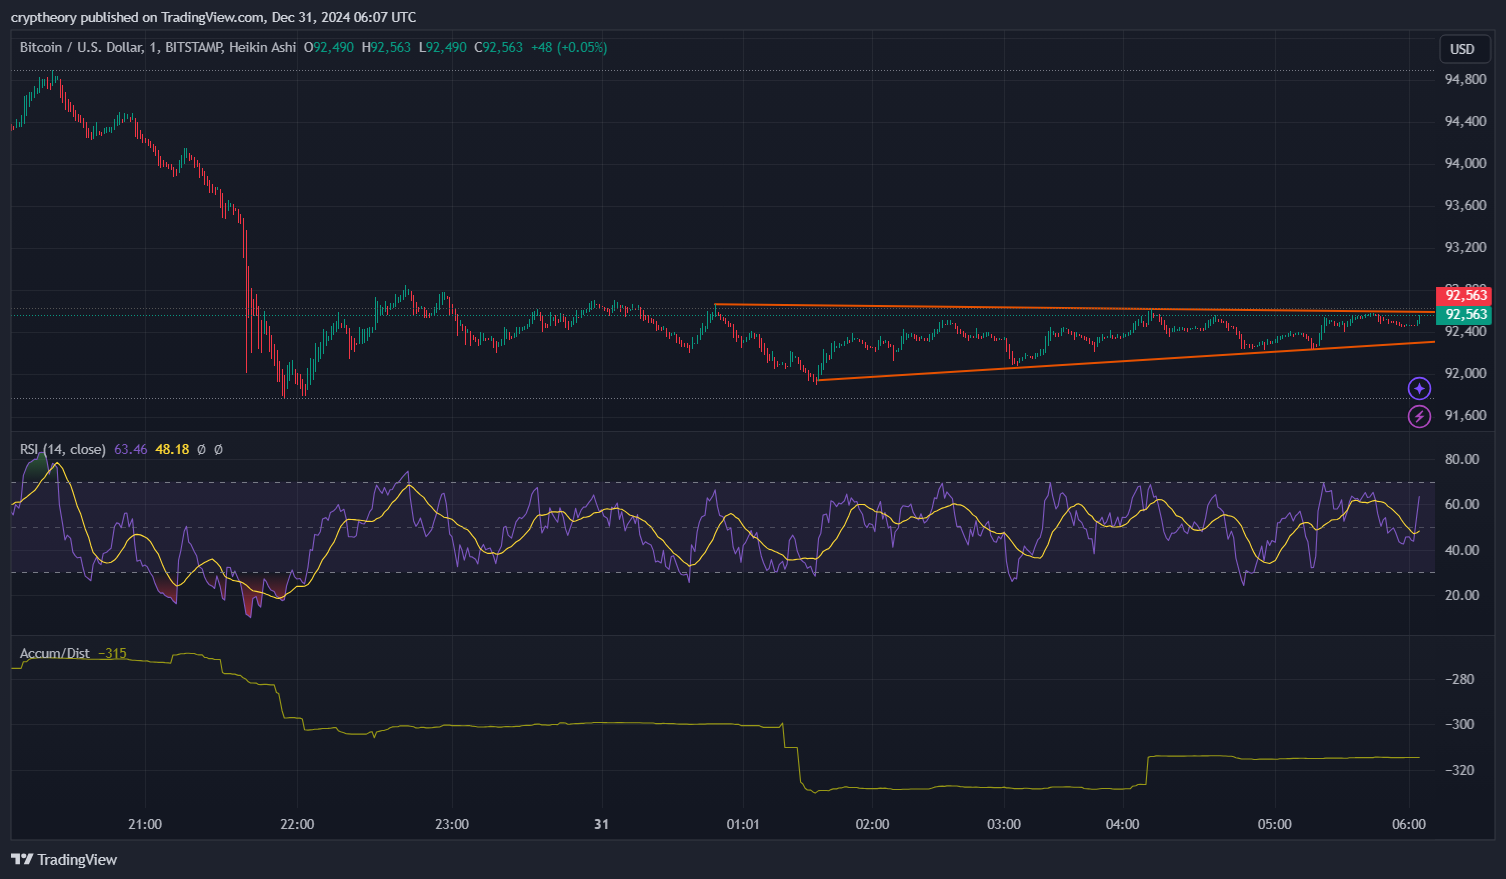
- RSI (Relative Strength Index): 55.71
- The RSI indicates a neutral-to-slightly-bullish sentiment, sitting comfortably in the middle zone.
- No overbought (>70) or oversold (<30) conditions are currently in play.
- RSI-based Moving Average (MA): 47.44
- The RSI-based MA suggests neutral momentum, with no strong bullish or bearish confirmation.
- Price is moving sideways, and momentum lacks significant directional strength.
- Accumulation/Distribution (Accum/Dist): -315
- The Accum/Dist shows a negative reading, indicating that sellers are still slightly dominant in this phase.
- There’s a lack of strong accumulation pressure, suggesting caution among buyers.
📈 Key Observations from the Chart
- Pattern: An ascending triangle pattern is forming, with higher lows suggesting some buying pressure, while the resistance level remains horizontal at approximately $92,800.
- Resistance Zone: Strong resistance near $92,800, where multiple rejections have occurred.
- Support Zone: Support is holding near $92,200, with price respecting the ascending trendline.
📈 The Bearish Scenario 🐻
If Bitcoin can’t break above the descending trendline and trading volume remains weak, we might see the price revisit lower support levels around $91,500 or even the ominous $90,800 level. If that happens, expect Twitter (or X, as the cool kids say now) to flood with “Bitcoin is dead” posts faster than you can refresh your feed.
But don’t panic – Bitcoin has been declared dead more times than we’ve had “buy the dip” opportunities.
📊 The Bullish Scenario 🐂
If – and that’s a big IF – Bitcoin can break above $94,000 with strong volume, we could see a return to the $95,500-$96,000 zone. From there, it’s all about momentum and whether the whales had a nice holiday feast or if they’re still napping.
The first resistance target is $93,800, followed by $94,400. If we see a breakout, get ready for fireworks – metaphorically and literally, because it’s almost New Year’s Eve.
🧠 Sentiment Analysis – Confusion Reigns Supreme 🤯
The sentiment in the crypto space right now is like a New Year’s party where half the guests are dancing on tables screaming “$100K incoming!” and the other half are crying into their drinks muttering “$50K is inevitable…”
Market fear and greed indicators are bouncing between “Cautious Optimism” and “Absolute Panic.”
🛡️ Key Levels to Watch:
- Resistance: $93,200, $94,400, and if we’re feeling lucky, $96,000.
- Support: $91,800, $91,200, and the psychological level at $90,000.
If Bitcoin stays stuck in this descending channel, we might have to wait until January for any decisive moves.
🎯 2025 Outlook – A Glimmer of Hope?
As we wrap up 2024, the question on everyone’s mind is: “What about 2025?” Well, historically, Bitcoin likes to start the year with some excitement. January often brings renewed optimism, new money flows in, and price momentum picks up.
If this descending channel breaks to the upside, $100,000 Bitcoin might not just be a meme anymore – it could be reality.
Bitcoin Price Analysis December 31, 2024 🥂 Final Thoughts – Cheers to Uncertainty 🥂
Bitcoin’s current price action is a classic tale of uncertainty. Traders are watching the chart with one eye on the candles and the other on their champagne glasses.
Whether we start 2025 with fireworks above $95,000 or slide further down the trendline, one thing is clear – Bitcoin remains the most exciting asset on the planet.
As we close out the year: Stay calm, HODL on, and may your New Year resolutions include better stop-loss strategies. 🚀
Happy New Year, dear traders – may your charts be green, your trades be profitable, and your memes be spicy! 🎆🎇
- 🍪 Cookie DAO Price Prediction – January 3, 2025 🍪 - January 3, 2025
- Virtual Protocol Price Analysis – January 2, 2025 - January 2, 2025
- 🚀 Bitcoin Price Analysis – December 31, 2024: “Sliding into the New Year with Style (and Volatility)” 🎢 - December 31, 2024


