In the first half of the year, the mempool was full, now it is empty most of the time. Why?
The BTC mempool is almost empty – fewer routes
Over the last 12 months, there have been major changes in the entire BTC mining industry, which of course have an impact on network hashrate, mining profitability and transaction queues. The price and profitability of mining have fully recovered within months of China’s ban, but mempool – the pending transaction – is still empty most of the time.
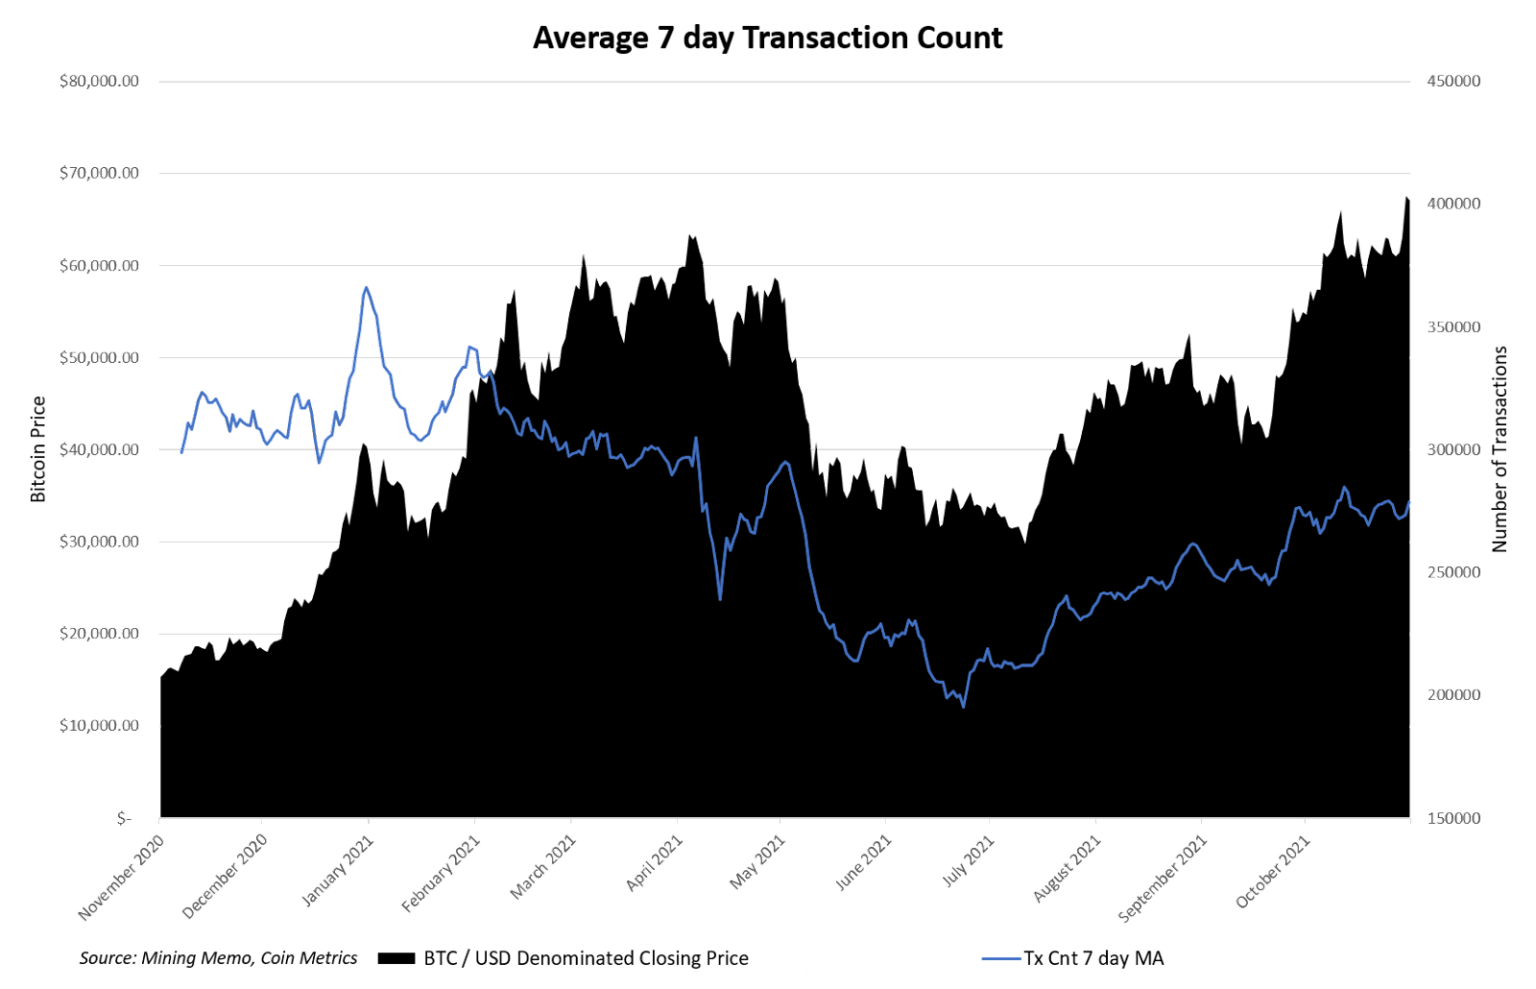
In short, this simply seems to mean that fewer people trade BTC compared to the beginning of the year, when the mempool was mostly full. Take a look at the mempool fullness chart below and you’ll notice a huge contrast between the first and second half of the year.
The simplest explanation for an empty mempool is that people are simply making fewer transactions and continuing the trend that began in June. Although the price of the primary asset has returned to the levels at the beginning of the year, the number of transactions in the network is now significantly lower.
Why is the mempool empty?
Here are some possible reasons.
- Layer 2 (L2) technology: The BTC mempool stores the transaction queue only for the main BTC blockchain. When people actively use scaling solutions (such as Lightning Network), small protocols migrate to those protocols and no longer appear in the BTC mempool. The Lightning Network is constantly growing, but it can hardly be the only or even the main catalyst for such mempool devastation. This means only fewer transactions on the main blockchain. And this is confirmed by the slight increase in the average transaction size on the main blockchain.
- Some transactions are becoming more efficient: BTC has seen a strong increase in the number of transactions using bech32 addresses, which can save up to 40% on fees. This can have a significant impact on mempool, given that almost 90% of all transactions sent were using bech32 or segwit.
- Fewer retail investors generally mean fewer transactions: smaller players come and go, and usually the number of transactions increases dramatically as the price sets new highs.
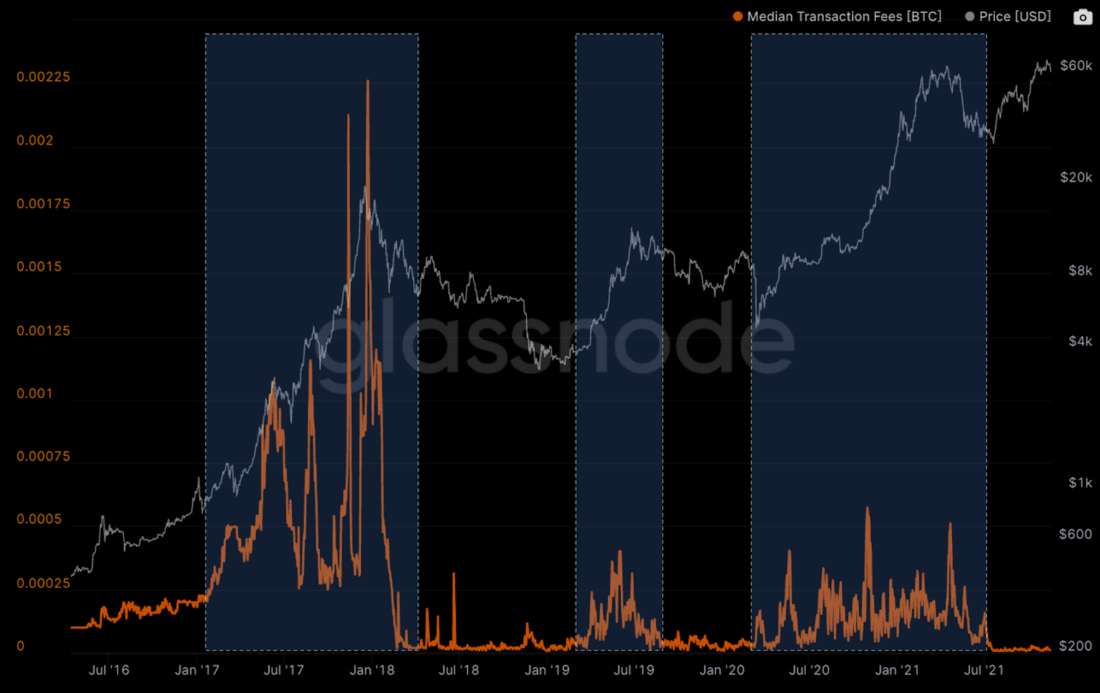
Overall, the network still processes a relatively large number of transactions. But the average fee rate for them is much lower today. And this is a sign of a healthy network that can efficiently transfer capital between users. Chart below shows the average transaction fees for the entire BTC price history. A significant increase in the average transaction fee can be observed in the highlighted areas of BTC price growth.
Omniverse is the key to the “metauniverse infrastructure”, says Nvidia founder Huang Renxun


