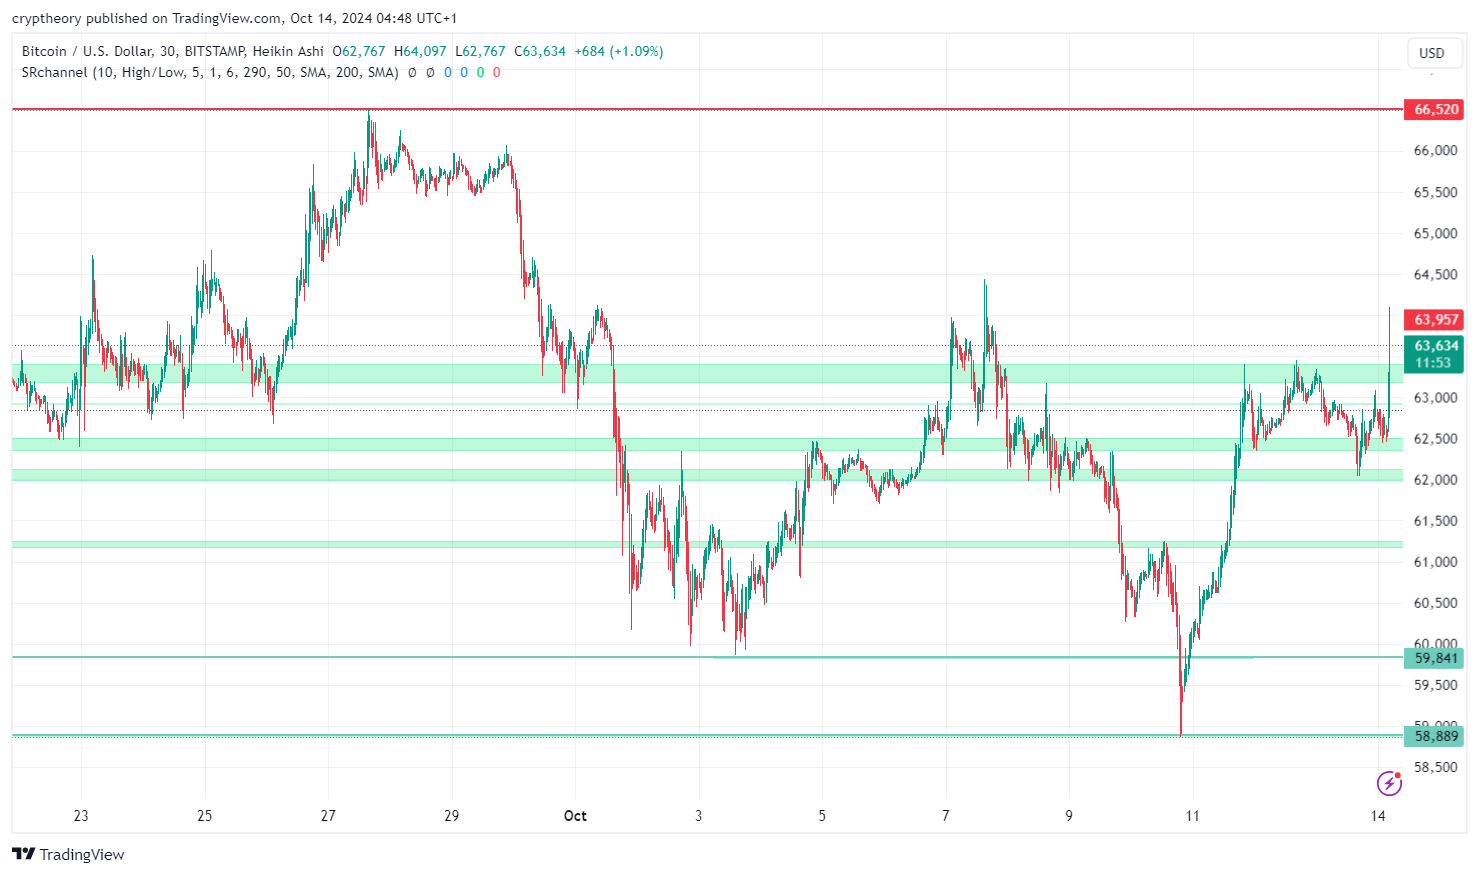
As of October 14, 2024, Bitcoin (BTC) is trading around $63,829, maintaining stability within a tight range. The price has been fluctuating just above the $60,000 mark for several days after facing resistance at around $66,000 earlier in the month. Several factors are contributing to the current consolidation, including macroeconomic uncertainty and recent inflation data from the U.S. Federal Reserve’s interest rate decisions.
Source: TradingView
Key Technical Insights:
- Support and Resistance: Bitcoin has strong support around $60,000, a level that has held firm despite several tests. Resistance is noted around the $66,250 zone, where the price struggled to break through in recent attempts.
- Short-Term Outlook: In the coming days, Bitcoin is expected to trade between $62,800 and $63,800, according to projections. A break above $63,800 could lead to a rally toward $64,500.
- Long-Term Potential: Analysts predict that Bitcoin could still see substantial growth, possibly reaching reach $80,000 to $100,000 by the end of 2024, driven by the anticipated effects of the 2024 Bitcoin halving and increasing institutional adoption of Bitcoin ETFs.
While the market shows some volatility, the overall outlook remains cautiously optimistic, with potential for upward movement as macroeconomic conditions improve.
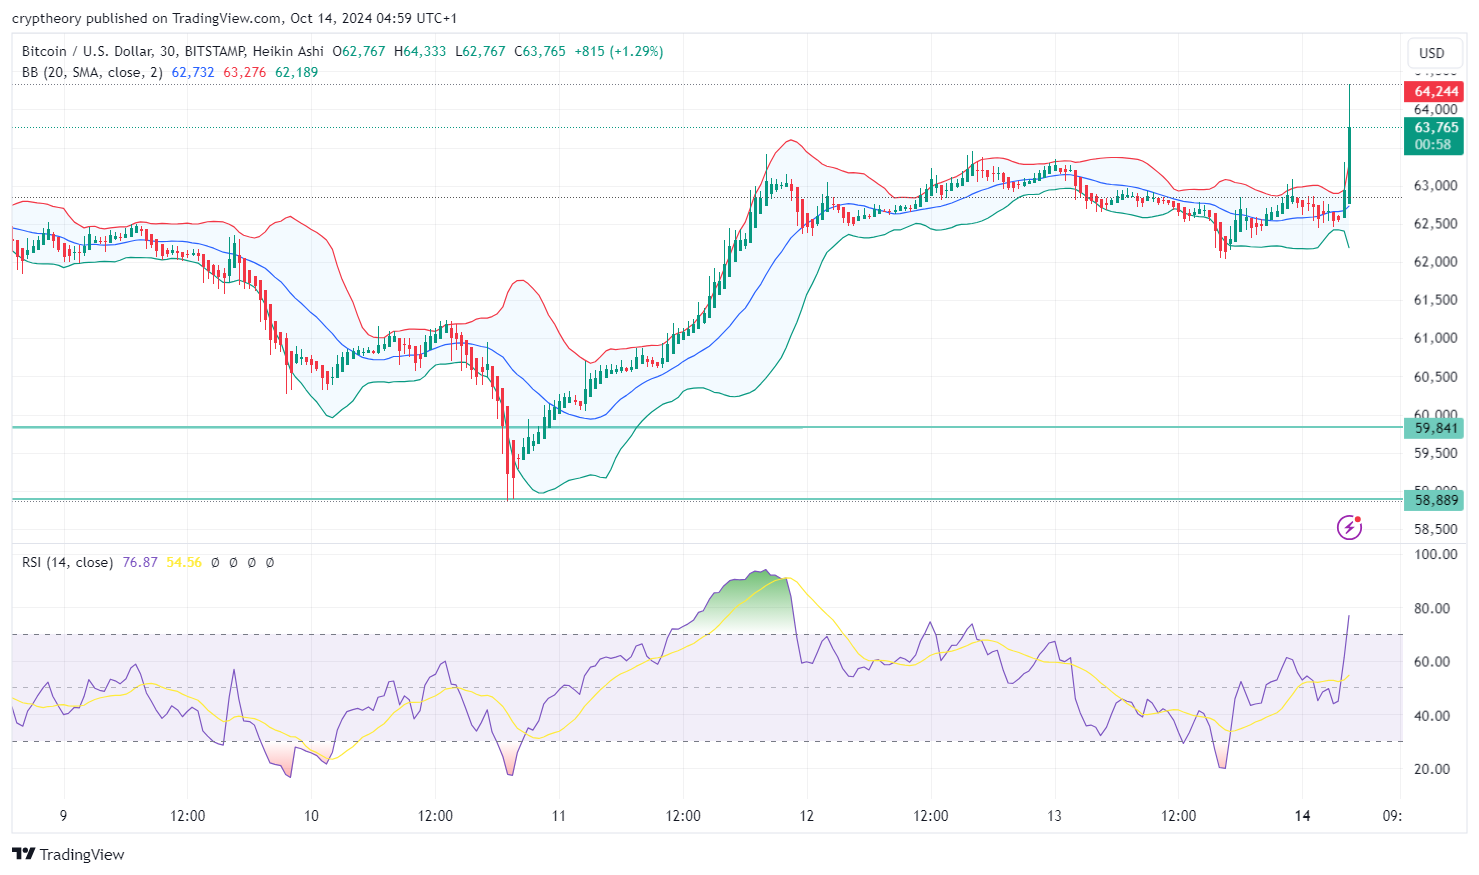
- Bollinger Bands:
- Bollinger Bands are currently showing a period of expanding volatility. The price has surged towards the upper band, which is around $64,244. This suggests that Bitcoin is potentially approaching overbought conditions.
- The middle band, representing the 20-period simple moving average, is at $62,189, indicating this level as a key short-term support.
- RSI (Relative Strength Index):
- The RSI is currently at 76.87, indicating that Bitcoin has entered the overbought territory. A value above 70 generally suggests that the asset is overbought, meaning there could be a potential pullback or correction in the near term. Traders should be cautious about possible retracements.
Conclusion:
- Bullish Indicators: The price breakout above the middle Bollinger Band and the current upward momentum suggest bullish conditions.
- Cautionary Signals: The high RSI value near 77 indicates that the market may be overbought, and traders should watch for a potential reversal or correction.
This is a pivotal moment for Bitcoin, and close monitoring of the price action and technical indicators will be important for determining the next direction.
- Russia to Slap a 15% Tax on Crypto Gains – The Bear Wants Its Share - November 20, 2024
- 70% of Airdrop Tokens Are Profitless—Here’s Why Your Freebies Might Be Worthless - November 19, 2024
- The Most Important Cryptocurrency News of November 14, 2024 - November 15, 2024


