Table of Contents
Ladies and gentlemen, buckle up, because Cardano (ADA) has been taking us on a wild ride, and judging by today’s chart, this rollercoaster isn’t stopping anytime soon! Let’s dive into the price action and dissect every twist, turn, and bump along the way.
The Great Climb and Resistance Dance 🧗♂️
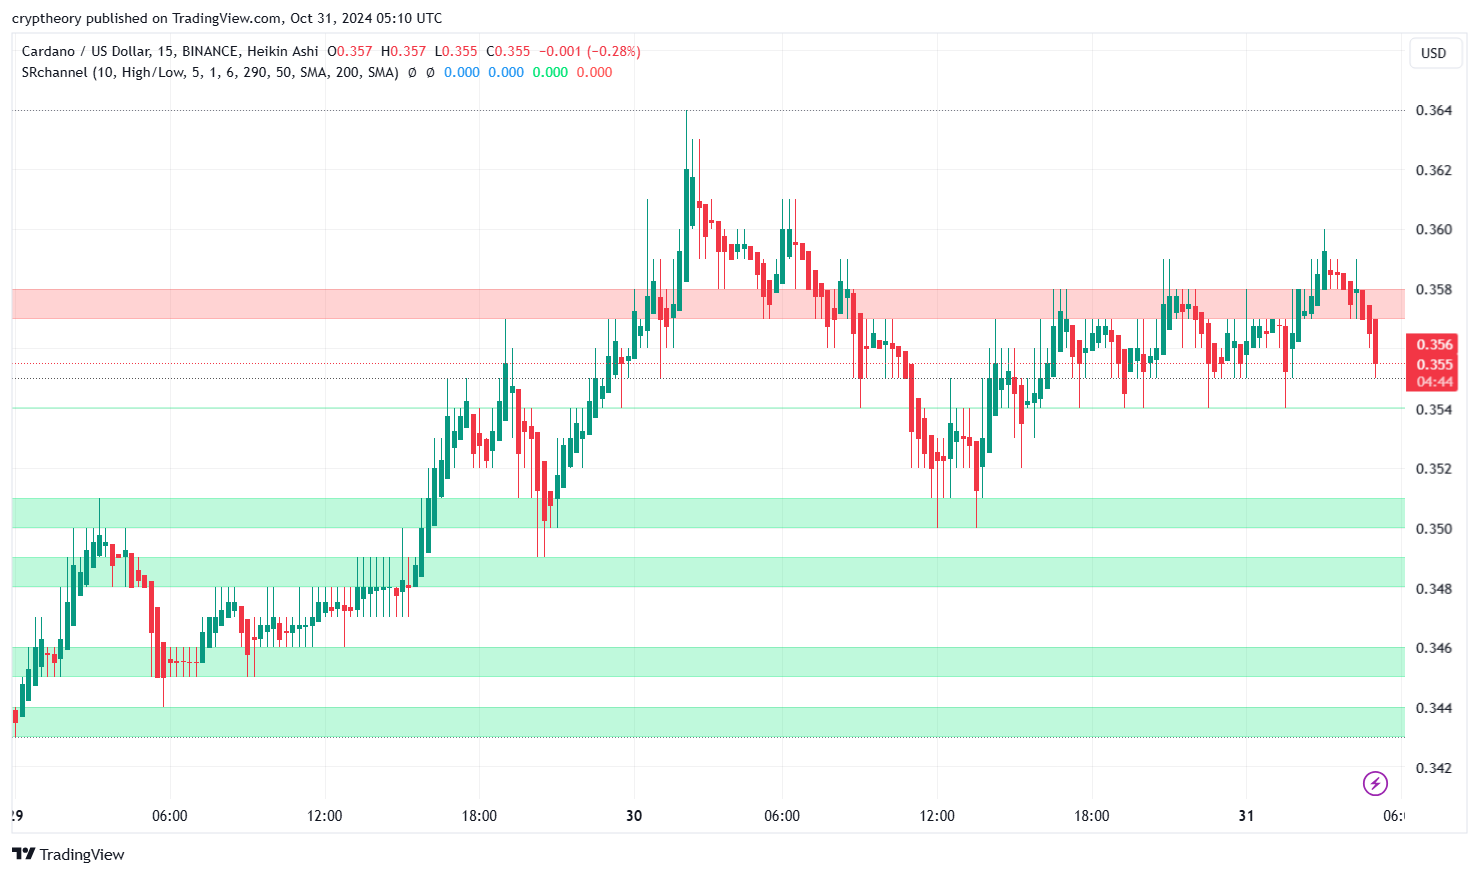
Starting on October 29, ADA began a determined climb, pushing up from the support levels around $0.348 and making its way past $0.352 with vigor. It seemed that nothing could stop this momentum—until, of course, ADA hit the dreaded $0.357 – $0.358 resistance zone, where price action decided to pause and catch its breath. Here, Cardano played a classic game of “touch-and-go,” bouncing back from this resistance zone multiple times as if saying, “Not today, resistance. But maybe soon!”

Support Levels: ADA’s Cozy Cushion Zones 🛋️
Below this resistance, ADA found comfort in several levels of support. The $0.354 – $0.352 range served as a cushioned couch, where price took a few breathers after each encounter with resistance. And below that, the more substantial $0.348 – $0.346 zone acted as the king-size bed for ADA’s mini-dips. If ADA was a person, these support levels would be the soft bed it falls back onto after every tiring upward sprint.
Price Consolidation: The Waiting Room of Decision-Making 🕰️
Throughout the chart, ADA seems to be stuck in a suspense-filled “will-it-or-won’t-it” phase, stuck between strong support and resistance. Picture ADA pacing back and forth, like a protagonist in a movie, contemplating its next big move. Should it push past $0.358 and head towards the stars? Or should it retreat to $0.350 and regroup? Every dip and rise within this range has traders holding their breath.
What’s Next? The $0.360 Dream and the $0.350 Fall 🪂
All eyes are on $0.358 – $0.360 as the “promised land” where bulls hope ADA will break through. A successful rally past this level could open the doors to $0.362 and beyond, sparking excitement for higher targets. However, if bears take control, we could see ADA dipping back into the lower $0.348 support, which would surely test the patience of optimistic holders.
Conclusion: Cardano, the Entertainer 🎭
Today, ADA has shown us every emotion from hope to frustration, making the chart look like the stage of a dramatic theater play. Traders are left wondering if ADA will finally break free from the resistance zone’s grip, or if it will settle back down to its comfort zone at $0.350. Either way, this ADA show has been worth the watch—and the popcorn.
Cardano Price Prediction: Analyzing RSI, Bollinger Bands, and RSI-Based Moving Average

RSI (Relative Strength Index)
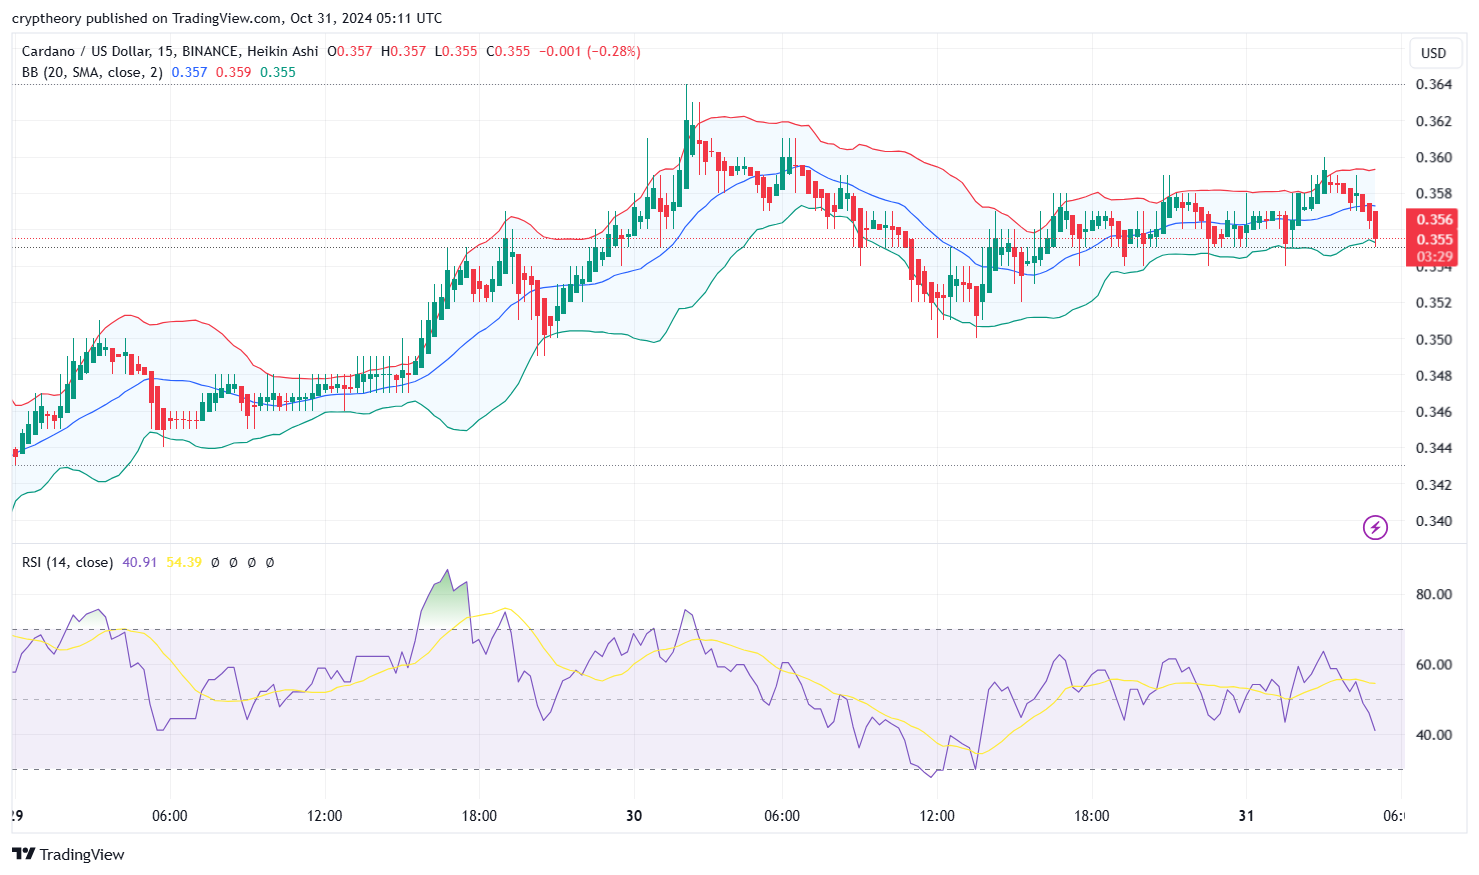
- The RSI (14) is currently at 40.91, indicating a mildly bearish sentiment. This level suggests that ADA may be oversold in the short term, with potential for a reversal or stabilization if buying pressure increases. The recent drop below the midpoint implies limited upward momentum.
Bollinger Bands
- Middle Band: The middle Bollinger band (SMA) stands at 0.357, showing a close alignment with ADA’s current trading level, suggesting a consolidation phase.
- Upper Band: Positioned at 0.359, the upper band acts as a resistance level, indicating where ADA might struggle if it attempts an upward move.
- Lower Band: The lower Bollinger band is at 0.355, providing immediate support. Price movements towards this band signal short-term bearish pressure, but it also offers a potential buying zone if support holds.
RSI-Based Moving Average (MA)
- The RSI-based MA line, represented by the yellow line, is around 54.39. With the RSI below this moving average, ADA’s recent downtrend shows weaker bullish momentum. If RSI rises back above this level, it could signal renewed interest from buyers.
Conclusion
Currently, ADA is in a consolidation phase, with Bollinger bands indicating limited volatility. Should the price hold above the lower band and RSI-based MA, we might see a mild recovery. A break above 0.359 could push ADA toward new resistance zones, while a drop below 0.355 may indicate further declines.
- Bonk Price Analysis – November 19, 2024: Bark or Bite? - November 19, 2024
- CEO Ripple Labs Criticized for Promoting XRP and CBDCs in Alleged Meeting with Trump - November 18, 2024
- Pepe Price Analysis 18/11/2024: The Amphibian Chronicles - November 18, 2024


