Table of Contents
Ah, Cardano (ADA), the beloved underdog of the crypto world, decided to party hard this weekend, throwing an unforgettable price celebration on November 11, 2024. Let’s dive into the colorful narrative of what exactly went down—and oh boy, it’s quite the tale. ADA price analysis is on the way.

Act I: The Pre-Party Lull
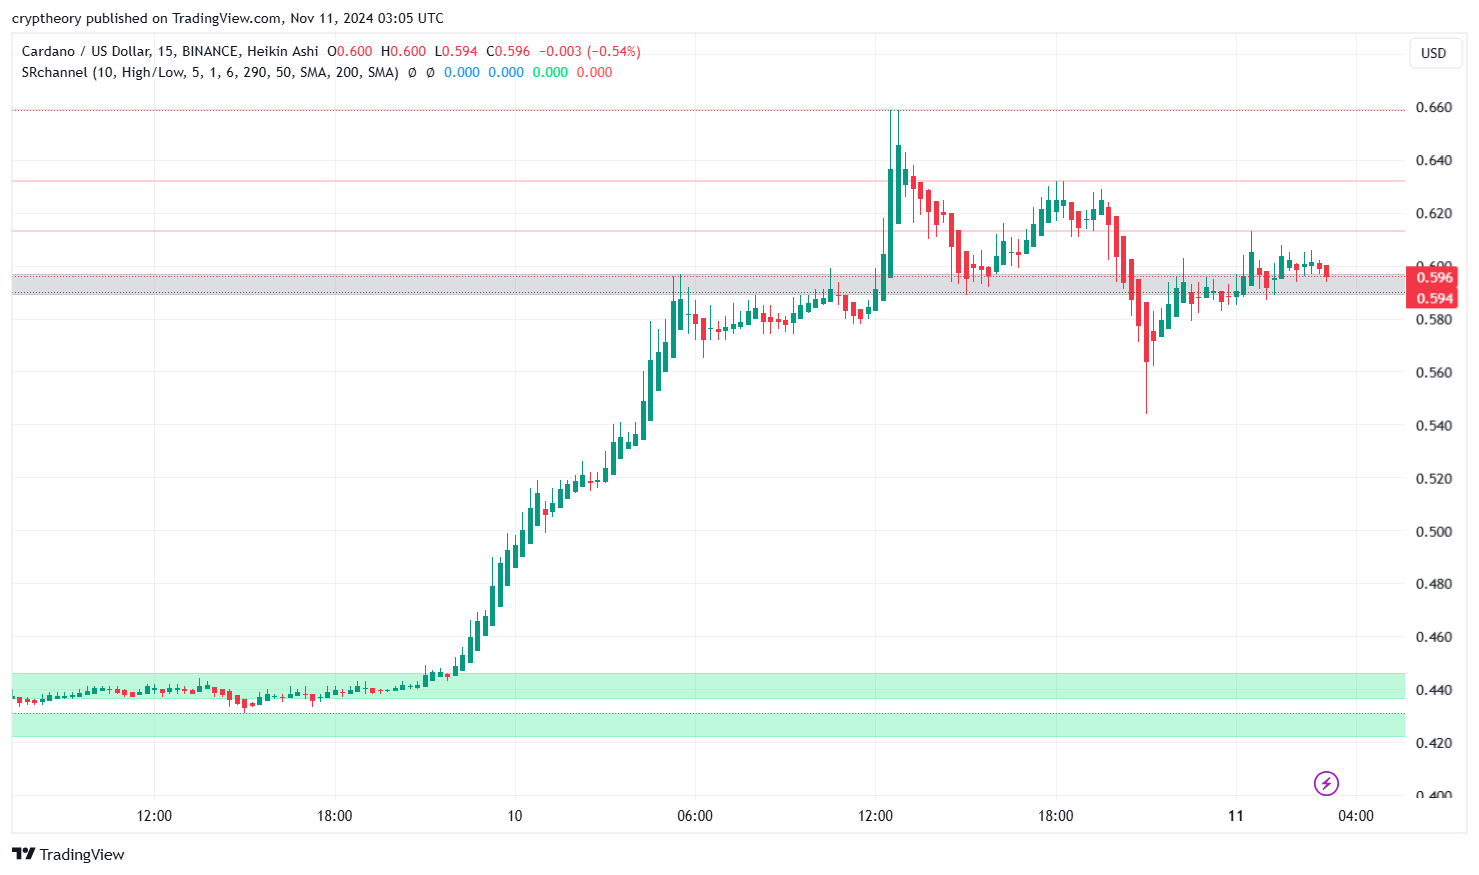
For much of Saturday, ADA seemed to be in a serene slumber, lounging comfortably between the $0.42 and $0.44 levels. A solid demand zone, represented by the pale green rectangles in the charts, cradled the price like a cozy blanket. Traders were yawning, debating whether to rewatch their favorite Netflix series or, God forbid, touch grass. Little did they know, ADA was preparing to bust some serious moves.
Act II: “Hold My Smart Contracts”
As Sunday rolled in, ADA clearly said, “Enough of this sideway nonsense!” and rocketed upwards like it was fueled by pure optimism—or perhaps caffeine. Breaking past the $0.50 resistance level like a rebellious teenager sneaking out at midnight, ADA soared into the $0.60 territory. Cue confetti and a standing ovation for the breakout.
On the 15-minute Heikin Ashi chart, those lush green candles didn’t just whisper bullishness—they screamed it from the rooftops. The price’s relentless ascent left traders scrambling to figure out if this was a genuine move or just ADA being ADA (read: unpredictably eccentric). Spoiler: it was the real deal.
Act III: The Overachiever’s Hangover
The euphoria reached its peak at $0.60, and for a brief moment, ADA had dreams of higher highs. Some optimists in the community started chanting “$0.70 next!” while others prudently cashed out, content with their freshly minted profits.
But alas, gravity is a thing, even in the crypto universe. A sharp pullback ensued, dipping the price toward $0.58 before stabilizing in the $0.59-$0.60 zone. Think of it as ADA taking a breather after sprinting a marathon. No major panic here—just a healthy retracement.
According to the provided charts, Cardano (ADA) gained an impressive +36.81% over the weekend! 🚀
Support and Resistance Zones:
-
- Support: The $0.42-$0.44 range remains a fortress of demand. ADA’s weekend action reaffirmed this zone as a “home base” where price finds comfort.
- Resistance: The $0.60 level is now the critical psychological and technical barrier. A clean breakout above here could trigger another moonshot.
ADA price Forecast: The Day After the Party
As the market cools down, ADA holders are left nursing their metaphorical hangovers. Will it consolidate around $0.59, sipping electrolyte drinks and biding its time? Or will it grab another energy drink and head for $0.65? Either way, traders will be watching closely.
Summary: ADA’s weekend performance was nothing short of spectacular. From a quiet range to a fireworks display, it reminded everyone why crypto trading is both exhilarating and nerve-wracking. Whether you’re a hodler, a trader, or just a bystander enjoying the show, one thing’s for sure: Cardano knows how to throw a weekend party.
Cardano (ADA) Cools Off: RSI and Bollinger Bands Signal Consolidation Phase
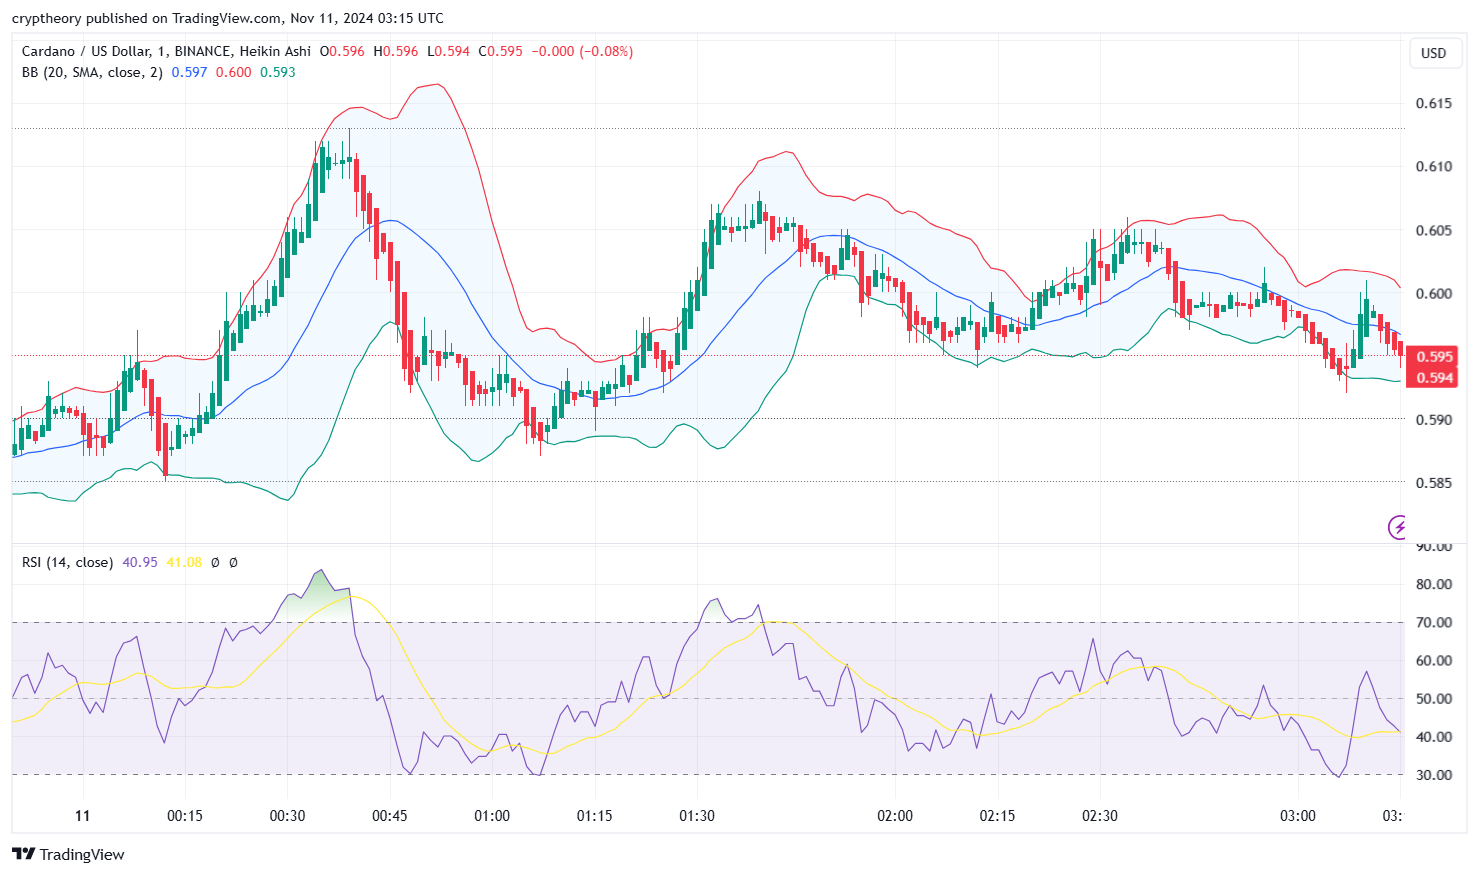
After a weekend rally that saw Cardano (ADA) skyrocket by over 36%, the momentum appears to be taking a breather. As the price consolidates near $0.595, key indicators like RSI and Bollinger Bands suggest the market is in a cooling-off phase. Here’s a closer look at what these indicators are telling us about ADA’s next potential moves.
Relative Strength Index (RSI)
- Current RSI Value: The RSI (14) is hovering around 40.95, indicating that the momentum is currently in the lower neutral range, leaning slightly toward bearish sentiment.
- Trend: After peaking earlier, RSI has cooled off, reflecting a slowdown in bullish momentum and a slight dominance of selling pressure.
- Key Levels:
- Overbought: Not currently relevant as RSI is far below 70.
- Oversold: RSI is still above 30, suggesting the market isn’t in oversold territory yet but is closer to support levels.
RSI-Based Moving Average
- Current Value: The RSI moving average line is at 41.08, closely tracking the RSI itself, indicating a weak trend direction.
- Interaction with RSI:
- The RSI is slightly below the moving average, signaling minor bearish divergence and reduced upward momentum.
- This could indicate further short-term consolidation unless momentum shifts.
Bollinger Bands
- Current Status:
- Upper Band: At approximately 0.600, suggesting that recent price action tested the upper boundary before reverting lower.
- Lower Band: At around 0.593, providing a support zone in case of further retracement.
- Middle SMA (20): Positioned at 0.597, currently acting as a mild resistance, as the price is consolidating below this line.
- Price Movement:
- The price is currently trading near the lower half of the bands, reflecting lower volatility and reduced bullish momentum compared to earlier surges.
- Bollinger Bands have slightly contracted, indicating a cooling-off phase and potential for breakout or continued range-bound behavior.
- Outlook:
- If the price breaks below the lower band, it could trigger further bearish momentum.
- A break above the middle SMA could reignite upward movement, with the upper band as the immediate resistance target.
Conclusion
- The RSI and Bollinger Bands both suggest a cooling period following ADA’s recent explosive gains. Momentum has shifted to neutral/slightly bearish in the short term.
- Traders should watch for:
- RSI nearing oversold levels (<30) as a potential bounce zone.
- Price interaction with Bollinger Bands’ lower band for potential support.
- A breakout above or below the Bollinger Bands to confirm the next directional move.
- Bonk Price Analysis – November 19, 2024: Bark or Bite? - November 19, 2024
- CEO Ripple Labs Criticized for Promoting XRP and CBDCs in Alleged Meeting with Trump - November 18, 2024
- Pepe Price Analysis 18/11/2024: The Amphibian Chronicles - November 18, 2024


