Table of Contents
Welcome to Solana’s grand arena, where price levels fight epic battles and chart patterns look like works of modern art. Today, we’re witnessing Solana (SOL) as it navigates a maze of support and resistance levels, oscillating up and down like a boxer dodging punches in the ring. Welcome to Solana price analysisi fro 30/10/2024.
The Tale of Two Sides: Bulls in One Corner, Bears in the Other 💥
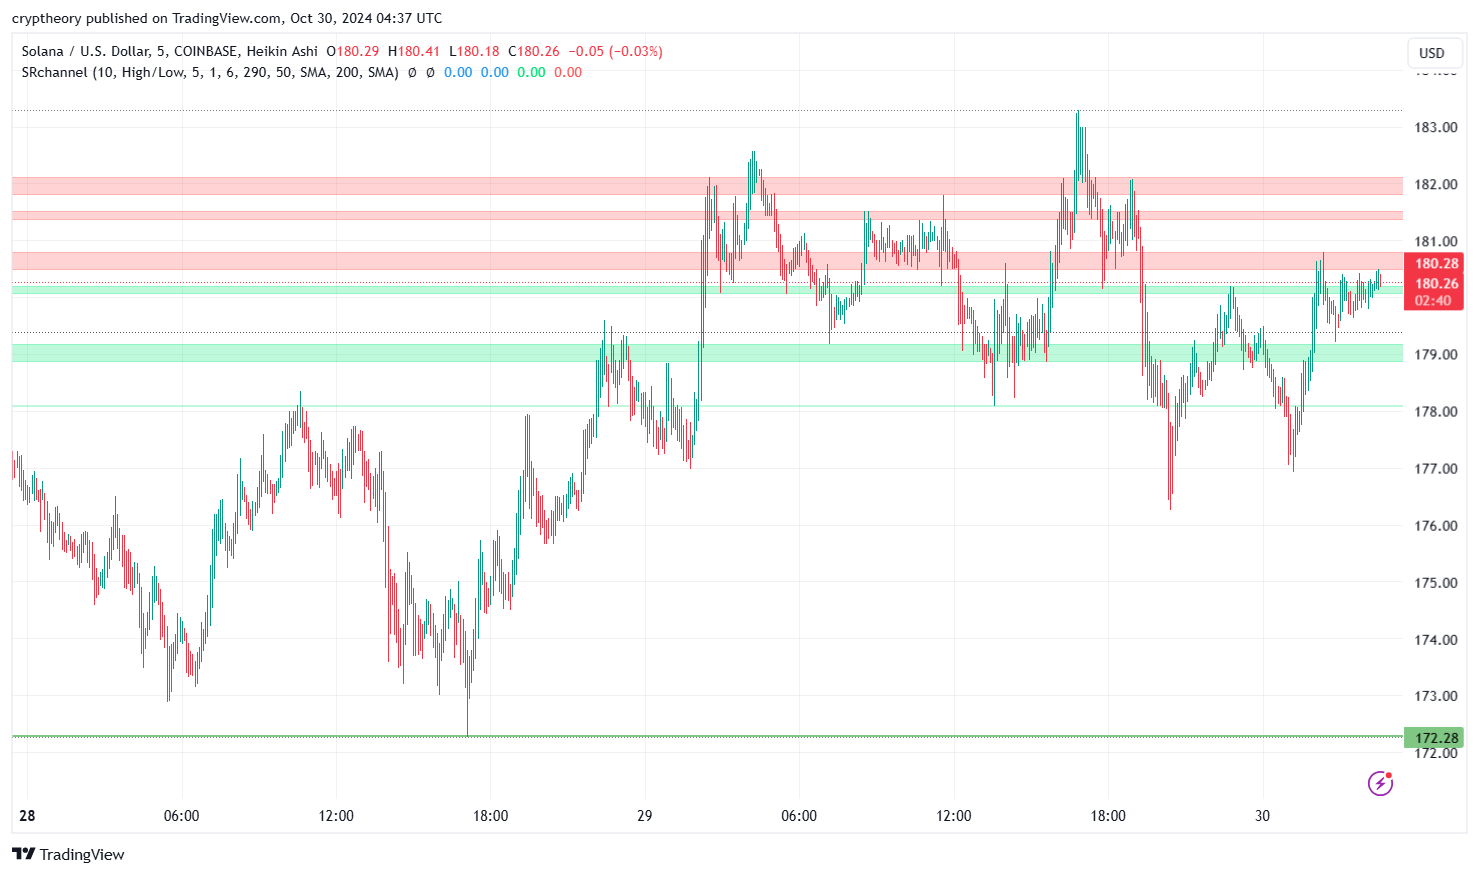
Our story begins with Solana bouncing between $176 and $182, as if it’s deciding whether it wants to stay grounded or reach for the stars. For every ambitious bull pushing SOL upward, there’s a bear ready to pull it back down. The result? A chart that looks like a roller coaster designed by an overzealous engineer.

Support and Resistance Zones: Solana’s Comfort Zones 🛋️
Let’s talk about the support levels, or as Solana might call them, its “resting spots.” We have solid support around $178 and $176, where Solana has repeatedly bounced back up, as if saying, “Alright, let’s try this again.” It’s clear that the buyers have set up camp here, ready to defend their territory like it’s the last pizza slice at a party.
Meanwhile, up at $181 – $182, we’ve got a sturdy resistance zone. Every time Solana inches closer, the bears step in with their “Not so fast!” attitude. It’s like Solana keeps trying to sneak past the bouncer, only to be gently nudged back into line. But knowing Solana, it might just wait until the bouncer gets distracted.
The Dips and Rallies: Solana’s Dramatic Flare 🎭
On the journey from $172 (the lowly depths of despair) to $182 (the hopeful peak), Solana has been through quite the adventure. From sharp dips that look like cliff-diving attempts, to rapid recoveries that could inspire a Rocky movie montage, this chart is not for the faint of heart.
Take a look at that plunge to $172. For a moment, it looked like Solana might dive straight through the floor, only to be caught by a safety net of buyers who must have been thinking, “Wow, what a bargain!” And just like that, Solana bounced back up, much to the relief of traders who had their “Buy the Dip” orders ready.
Consolidation Station: When Solana Decides to Chill 😌
After the dramatic highs and lows, Solana appears to be settling down between $179 and $181, perhaps taking a breather after all that excitement. Think of it as Solana’s equivalent of lying down with a cold drink after a workout. It’s in this range where SOL seems comfortable, but we know that comfort rarely lasts in crypto. Could Solana be gearing up for another big move?
The Big Question: Will SOL Break $182 or Slip Below $176? 🧐
Now, here’s where things get interesting. If Solana can push past $182, it might just be ready for a new adventure. Perhaps it will finally make a run toward $185 and beyond, waving goodbye to the bears in its rearview mirror.
But if those pesky bears manage to drag Solana below $176, we could see a retest of lower levels, with potential stops at $174 or even that familiar dip zone around $172. Solana’s next move could depend on market sentiment, a bit of luck, and possibly a few whales deciding to join the fun.
Conclusion: Solana, the Unpredictable Entertainer 🎬
In conclusion, Solana’s price action today is like a reality show – full of drama, unpredictable twists, and characters (support and resistance levels) that keep coming back. Will SOL find the strength to break past resistance and soar higher, or will it take another dive, giving dip-buyers a reason to celebrate? One thing’s for sure: Solana keeps us on our toes, and as traders, we wouldn’t have it any other way.
So, grab your popcorn, sit back, and let’s see where Solana decides to go next. It might just surprise us all! 🍿📈
Solana Price Prediction: Analyzing RSI, Bollinger Bands, and RSI-Based Moving Average

RSI (Relative Strength Index)
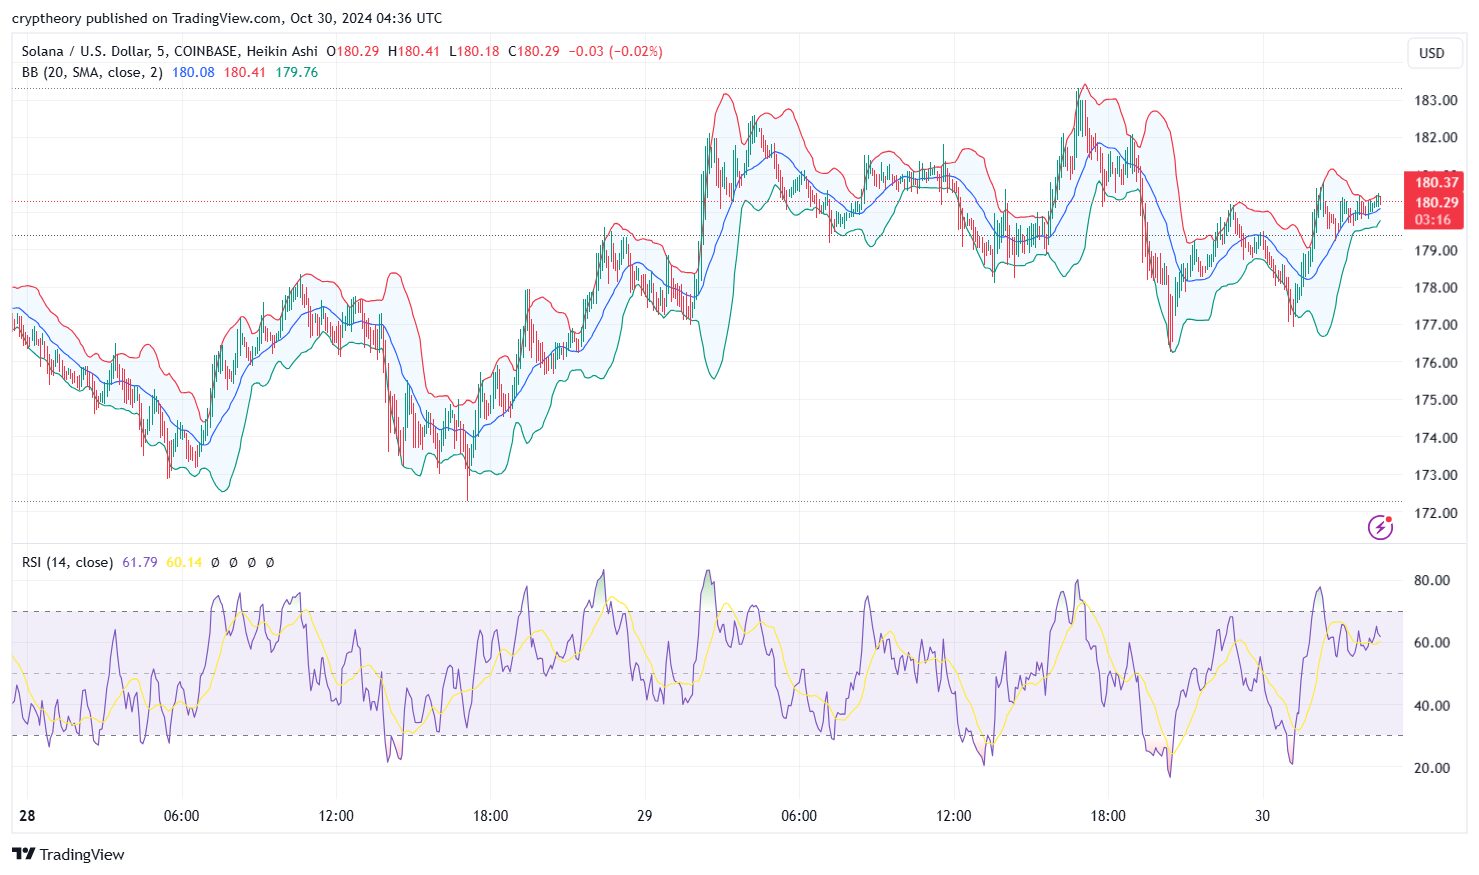
- The current RSI is at 61.79, which indicates a moderately bullish sentiment. It’s below the overbought threshold (70), suggesting that Solana has room for further upward movement before hitting overbought levels. However, it’s not low enough to suggest strong buying pressure from oversold conditions.
Bollinger Bands
- Middle Band: The middle Bollinger band, set at 180.41, serves as a 20-period simple moving average (SMA). Solana’s price is currently hovering around this level, showing a tendency to oscillate within this band.
- Upper Band: Positioned at 180.37, the upper Bollinger band represents the short-term resistance. The price is moving close to this band, signaling mild upward pressure but caution as it nears a resistance level.
- Lower Band: The lower band, at 179.76, serves as a support level. If Solana’s price drops, it may find support near this lower boundary, providing a safety net against significant downward moves.
RSI-Based Moving Average (MA)
- The yellow line on the RSI chart represents the RSI-based moving average, currently at 60.14. The RSI is slightly above this MA, suggesting that the bullish trend could continue as long as the RSI remains above its MA. This moving average acts as a confirmation signal for trend continuation; a dip below might indicate a weakening trend.
Conclusion
Solana is showing stable price action with moderate bullish potential. The current RSI suggests room for additional gains before hitting overbought territory, while the Bollinger bands indicate consolidation within a narrow range. If momentum holds, Solana may break above the middle Bollinger band toward the upper resistance zone. However, a decline could see support at the lower band around 179.76.
This analysis points to a cautious but optimistic outlook for Solana’s price, with potential for further growth if the RSI maintains its position above the moving average and resistance levels are tested.
- Bonk Price Analysis – November 19, 2024: Bark or Bite? - November 19, 2024
- CEO Ripple Labs Criticized for Promoting XRP and CBDCs in Alleged Meeting with Trump - November 18, 2024
- Pepe Price Analysis 18/11/2024: The Amphibian Chronicles - November 18, 2024


