25.07.21 Technical analysis ETH / USD – ETH under great pressure?
4 min readTable of Contents
We will now focus on Ethereum (ETH) which we left for a long time without any comment. However, something is beginning to emerge on the market and I think it deserves the attention of every investor in this coin.
As you may have noticed, altcoins have started to come to life slightly thanks to BTC. Some have appreciated by more than 30% in the last few days. Specifically, ETH is quite close to 30%. However, it is necessary to calculate that the current price growth has so far taken the form of another of the many ordinary retracements, of which there have been several recently. So don’t get caught in a potential trap, be careful.
Current situation at 1W TF ETH / USD
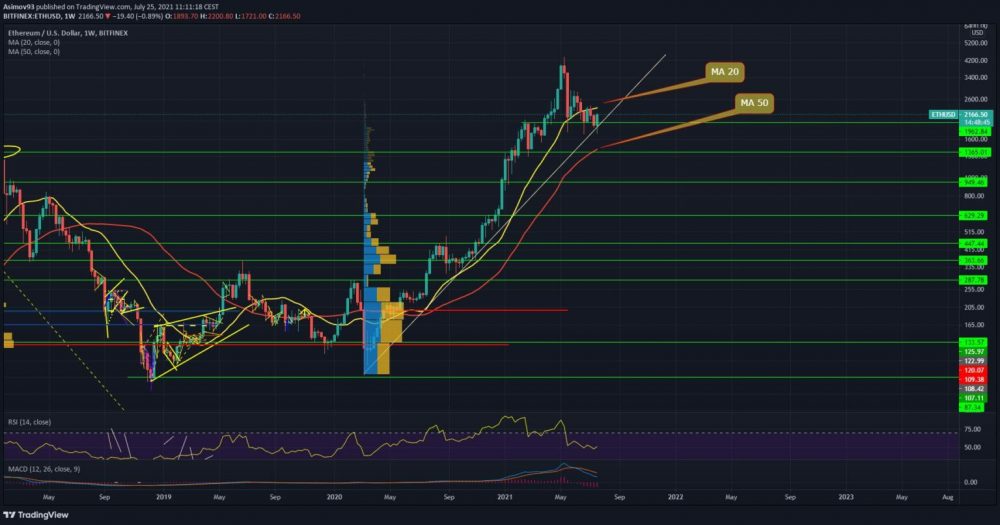
First, let’s look at a weekly graph with a logarithmic scale, where ETH still looks pretty good. Despite the fact that it depreciated by more than 61%, the coin basically follows an established trend that lasts a year and a half, and this week the exchange rate tested the drawn support diagonal, which begins in March 2020.
So even though ETH has lost a lot, it looks technically good at first glance. However, I must point out that if we switch to a linear graph, it is clear to everyone that the trend has broken significantly. In any case, the market has recently definitely lost its first important moving average MA 20.
Said moving average has since played the role of resistance, which can be observed in weekly candles from the turn of June / July. Another important moving average is up to MA 50, which is currently above the S / R level of 1,365 USD. One interesting thing is that BTC, for example, has already managed to break its 50-week MA.
Although the price returned this week, there was a breakthrough for a short time. While ETH is quite far from its MA 50. It would have to drop by more than 35% to be tested. Otherwise, the weekly chart shows that very strong levels are just as low as $ 629.29.
Indicators
The weekly RSI still oscillates around 50 points, so no change. The negative momentum on the MACD has partially weakened, but it is still quite strong.
Current situation at 1D TF ETH / USD
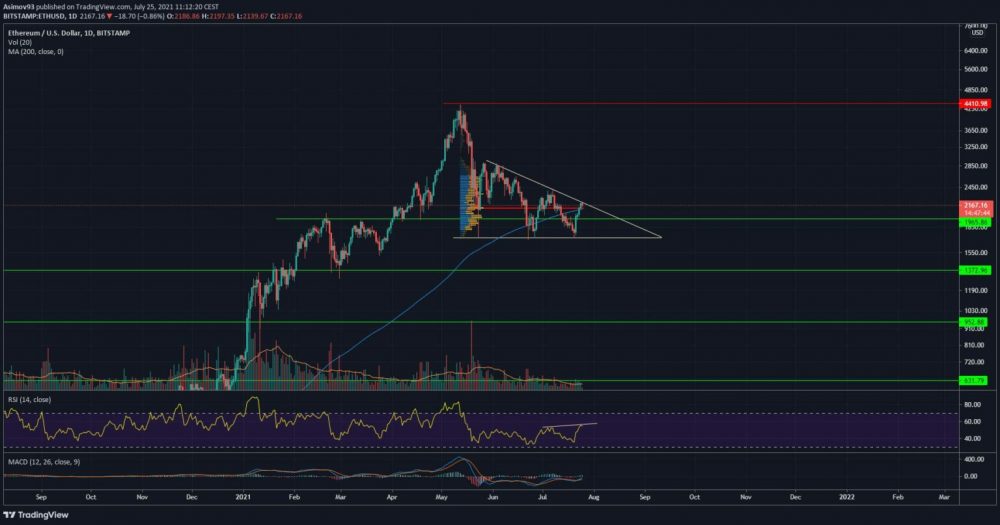
The daily chart is very important at the moment, because there is a recognizable simple pattern in the form descending triangle. This formation is, of course, bearish in nature, where we can easily recognize from the lower peaks that the shopper is running out of time over time. On the contrary, it is easier for bears to stamp each retracement into the ground faster.
If ETH wants to respect the drawn unit, it can lead to a strong sale and panic. If there have been weeks within the unit redistribution and thus recruiting shorts, it cannot be assumed that he will get rid of those shorts immediately. If anyone picks up shorts for a few weeks, they can hold these positions for months.
To prevent rinsing, ETH must break through the top wall of the triangle and overcome the July 7 price peak. This will ignite this threat to some extent. As for volumes, below-average development continues. We have seen a slight increase in the last few days, but it is still quite small.
Indicators
The bearish divergence is evident on RSI, which I also marked. Respectively, it is a so-called hidden bearish divergencewhich is not so common. We will see if the market leaves the signal unanswered. MACD has a bullish cross, but there have been so many signals lately that they need to be taken with a grain of salt. The course simply has to break through from the pattern.
In conclusion
From the development of previous weeks, it can be stated that ETH is under enough strong pressure. It is clear from the graph that bears have the upper hand and over time are stronger. Described logically does not immediately mean that he must win. The biggest battle takes place on BTC.
If it breaks through, so does ETH. However, if the crypto market experiences a bigger shock, ETH can catch on – it is good to calculate with this risk. It is necessary to monitor the signals and, above all, take the volumes into account. As soon as something big starts to happen, we will immediately recognize it from the volumes.
ATTENTION: No data in the article is an investment board. Before you invest, do your own research and analysis, you always trade only at your own risk. Cryptheory team strongly recommends individual risk considerations!


