According to halving analysis, BTC will reach an absolute bottom in the $ 24,000 zone
2 min readOne of the most popular debates in the crypto community revolves around four-year BTC halving cycle and its impact on the long-term cost of cryptocurrencies.
The price of BTC in 2021 failed to reach the long-predicted level of $ 100,000. Many crypto analysts are now asking about the prospects for the next 6 to 12 months.
The price of BTC is currently trading below $ 40,000, and various technical analysis metrics suggest that a further decline is more likely than a recovery between $ 40,000 and $ 45,000. Let’s take a look at analysts’ views on BTC’s longer-term outlook.
BTC could bottom out in November or December
A general overview of the four-year cycle theory was discussed on Twitter by crypto-analysts and pseudonymous Twitter user Wolves of Crypto. His analysis suggests that “the most likely bear market bottom for BTC will occur in November / December 2022.“
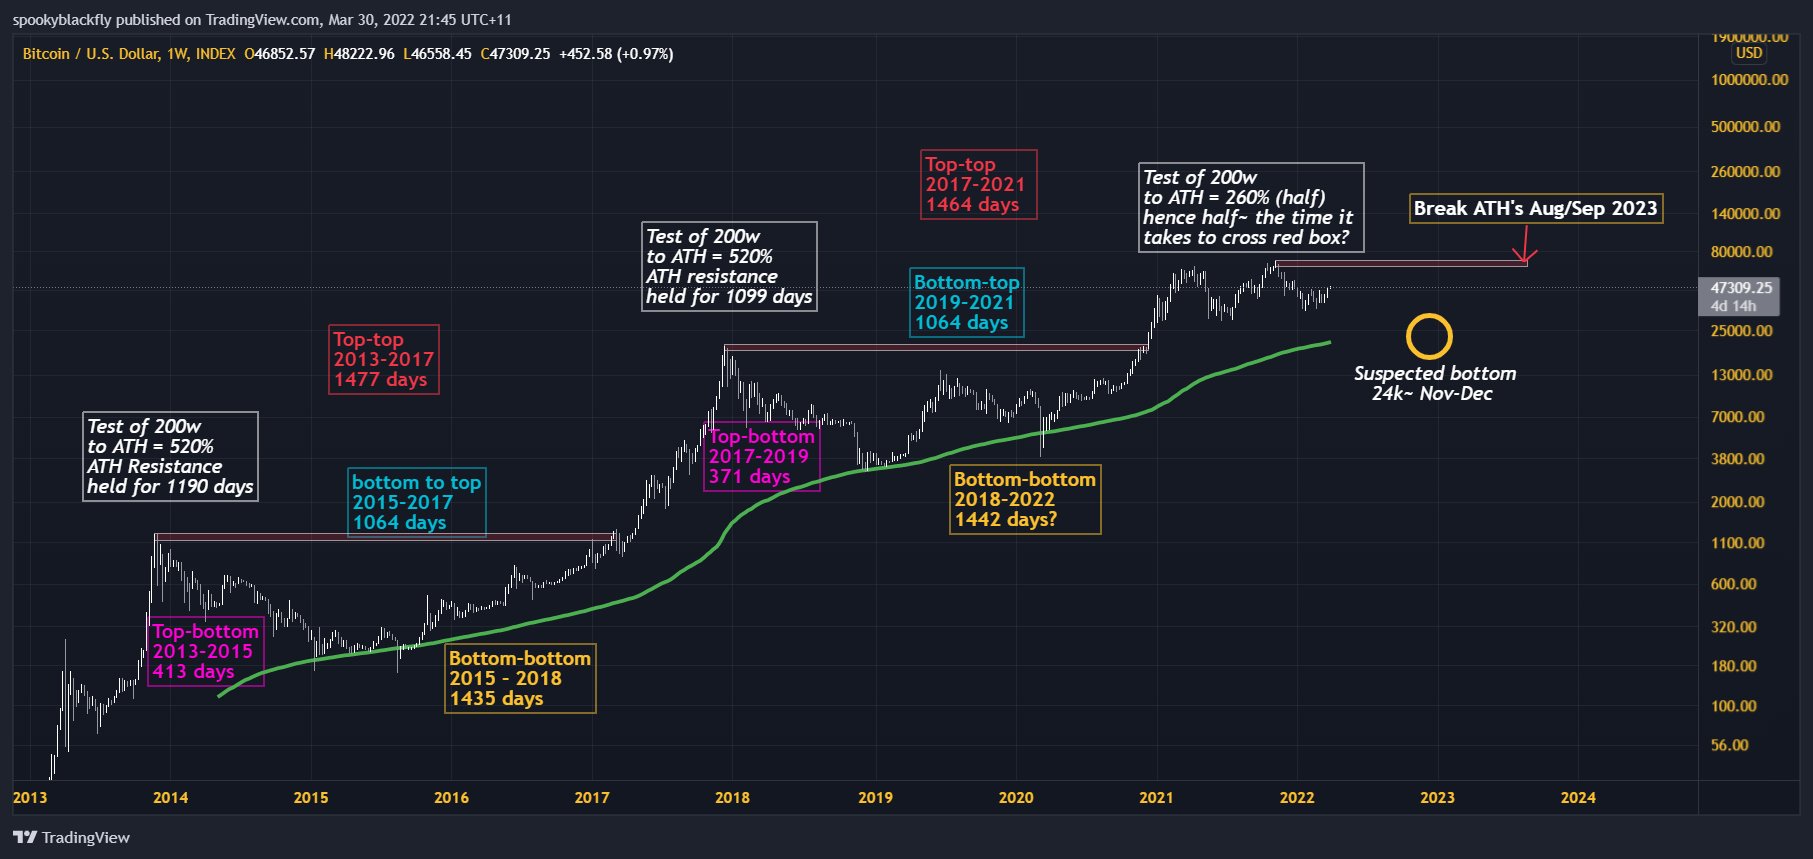
This projection assumes that the maximum price of BTC $ 68,789 of November 10, 2021 was the maximum of the last cycle and that the market is currently in the correction phase, which is usually observed after the peak of the cycle.
The analyst said that 200-week SMA has long been a tested indicator of the bottom of the bear market for bitcoins, and therefore will be the bottom probably placed at about $ 24,000.
If this model were to prevail, the BTC price will sometimes exceed its previous historical high sometime around August or September 2023.
The possibility that the bottom of the BTC could come before the end of 2022, indicated Willy Woo, independent market analyst. He published the following chart, which suggests that BTC seems to be a little undervalued.
Metrics Highly Liquid Supply Shock quantifies supply and demand in the chain and shows their relative movement in standard deviations from the long-term average.
As shown in the chart above, each time the oscillator dropped as low as the current value, the price of BTC entered a sharp rise shortly thereafter.
The price of BTC is at a medium-term low
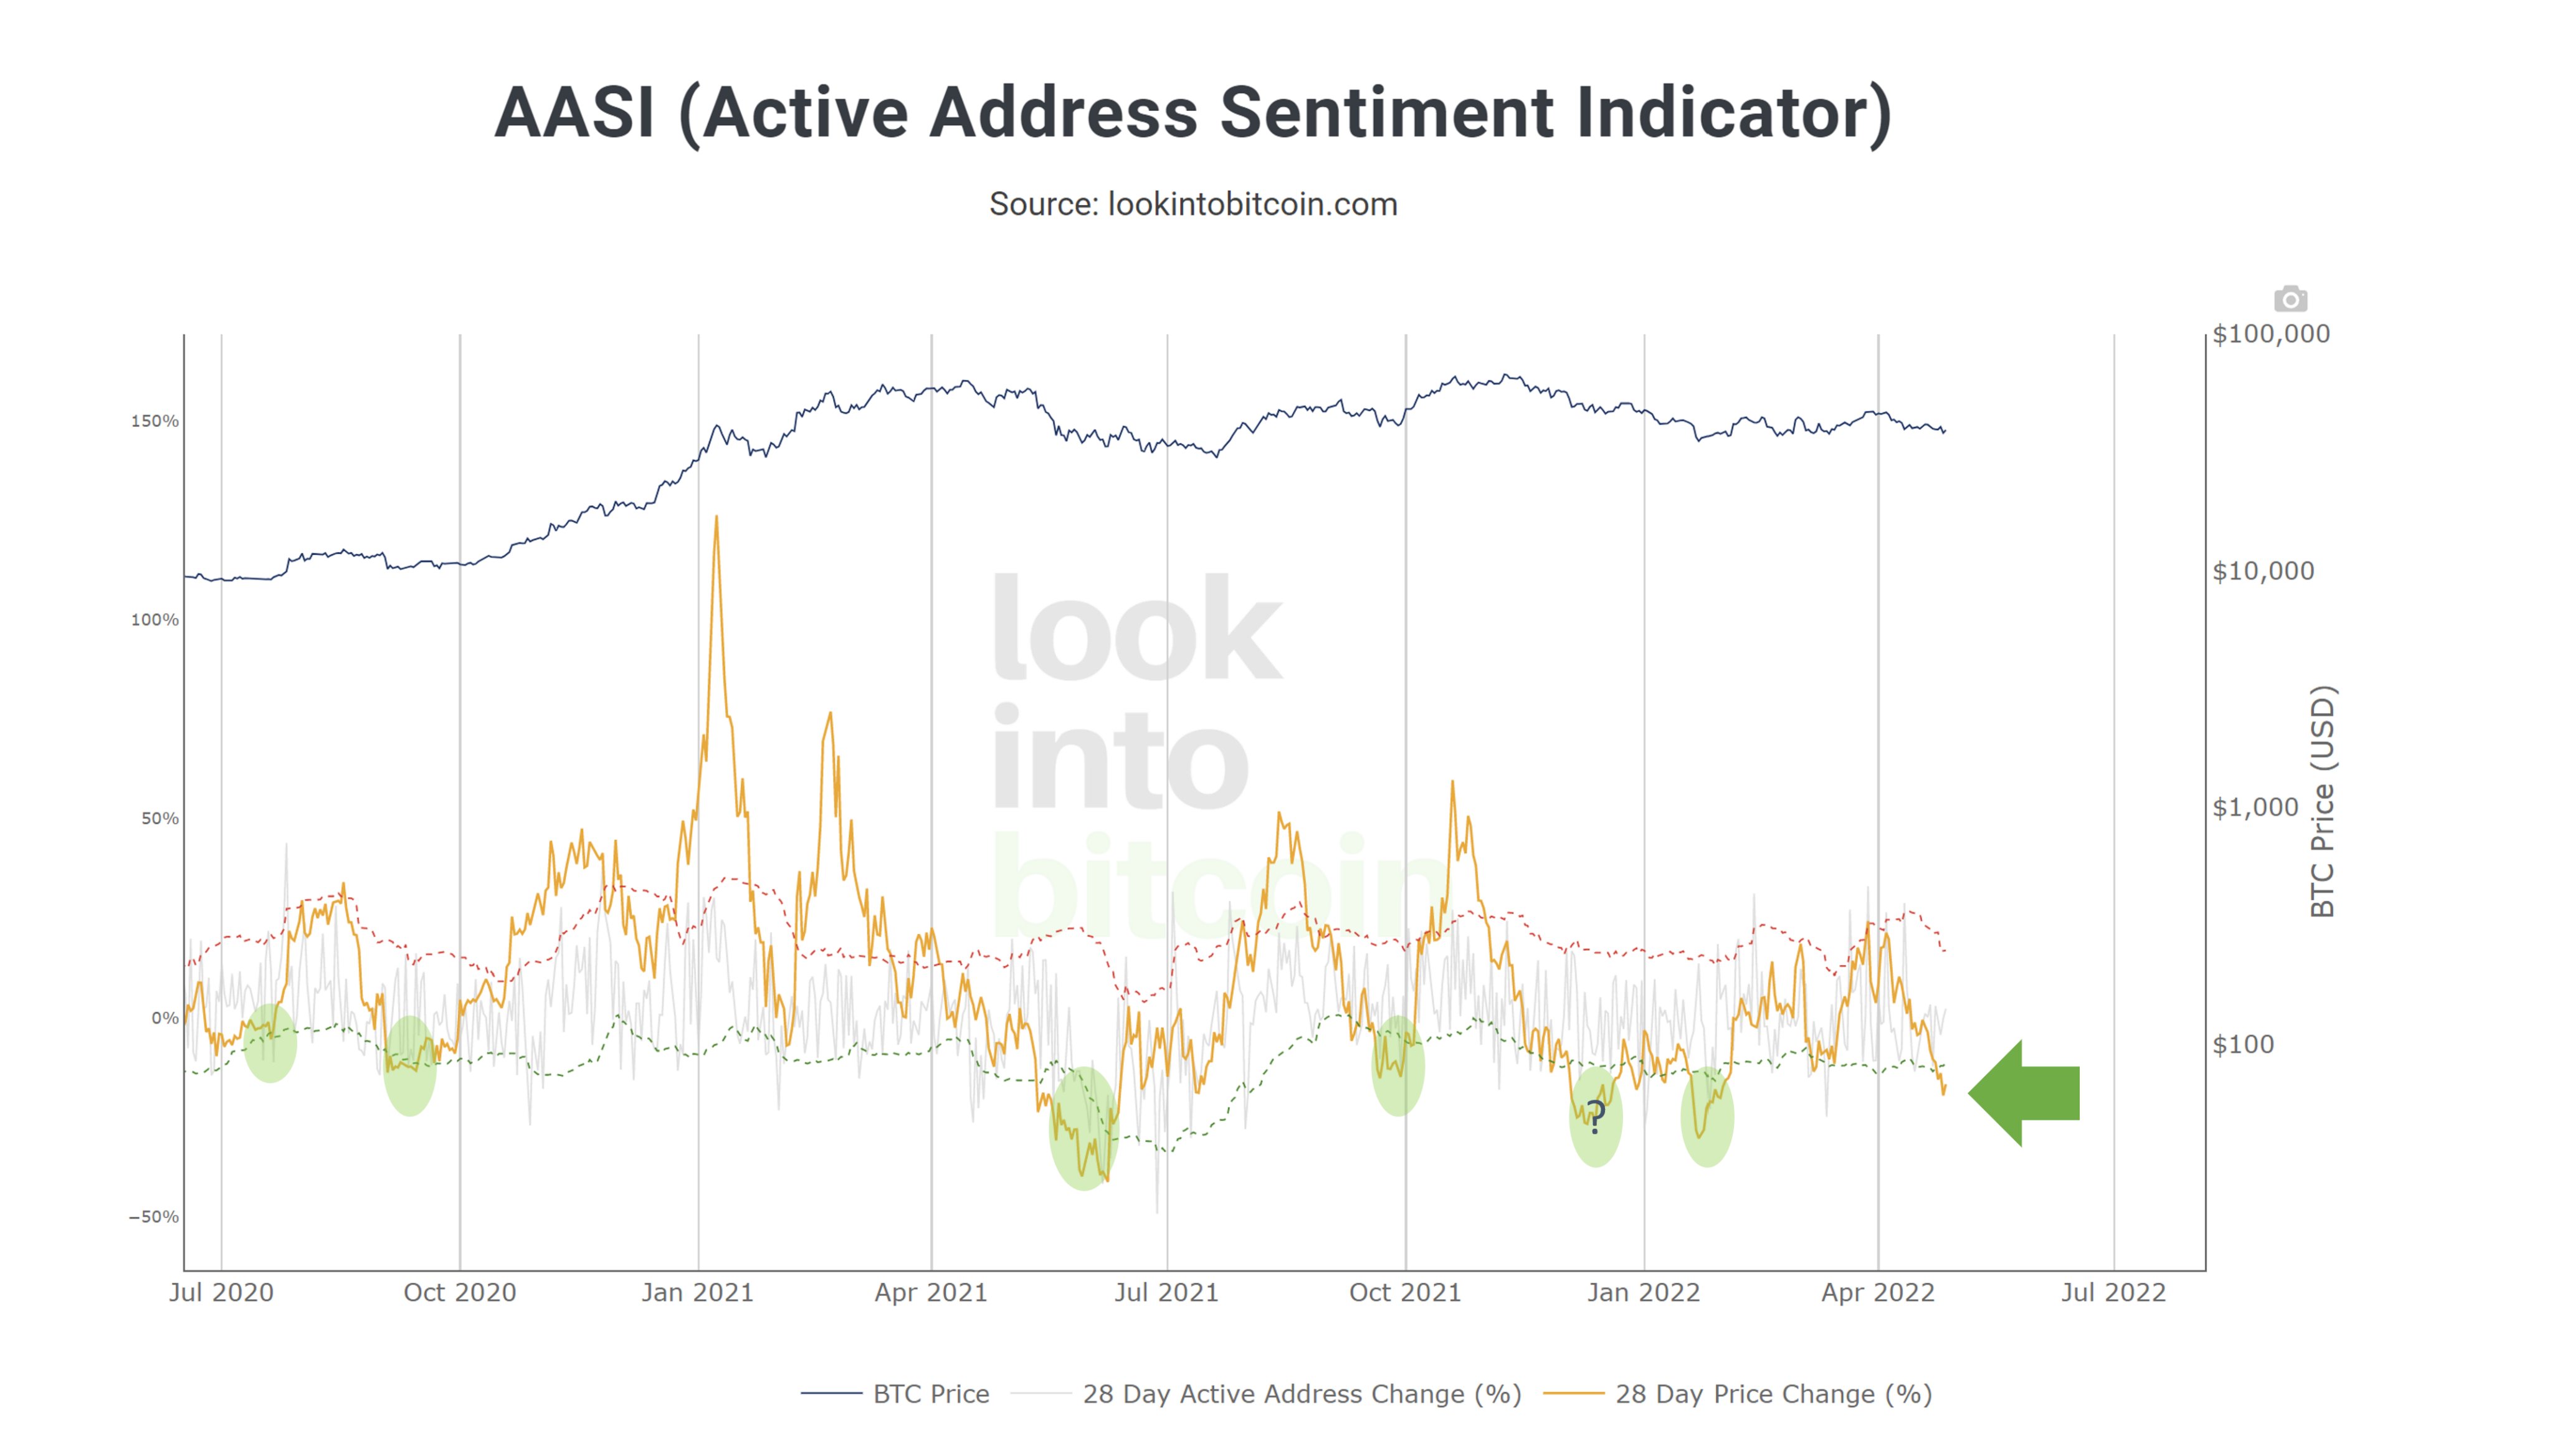
Many analysts believe that BTC could be in the optimal range accumulation as the crypto market analyst Philip Swift pointed out. Active Address Sentiment Indicator (AASI) suggests that BTC is in the accumulation area.
According to Swift, AASI is currently “back in the green zone”, suggesting that “the change in BTC price is at a reasonable level compared to the active change of address“.
Indeed, an examination of previous cases where AASI has reached levels similar to its current values shows that the price of BTC reached its lowest point at about the same time and continued to rise higher in the following weeks and months.
In general, the price of BTC appears to be in line with the previously established four-year cycle, albeit with a smaller percentage increase than expected.


