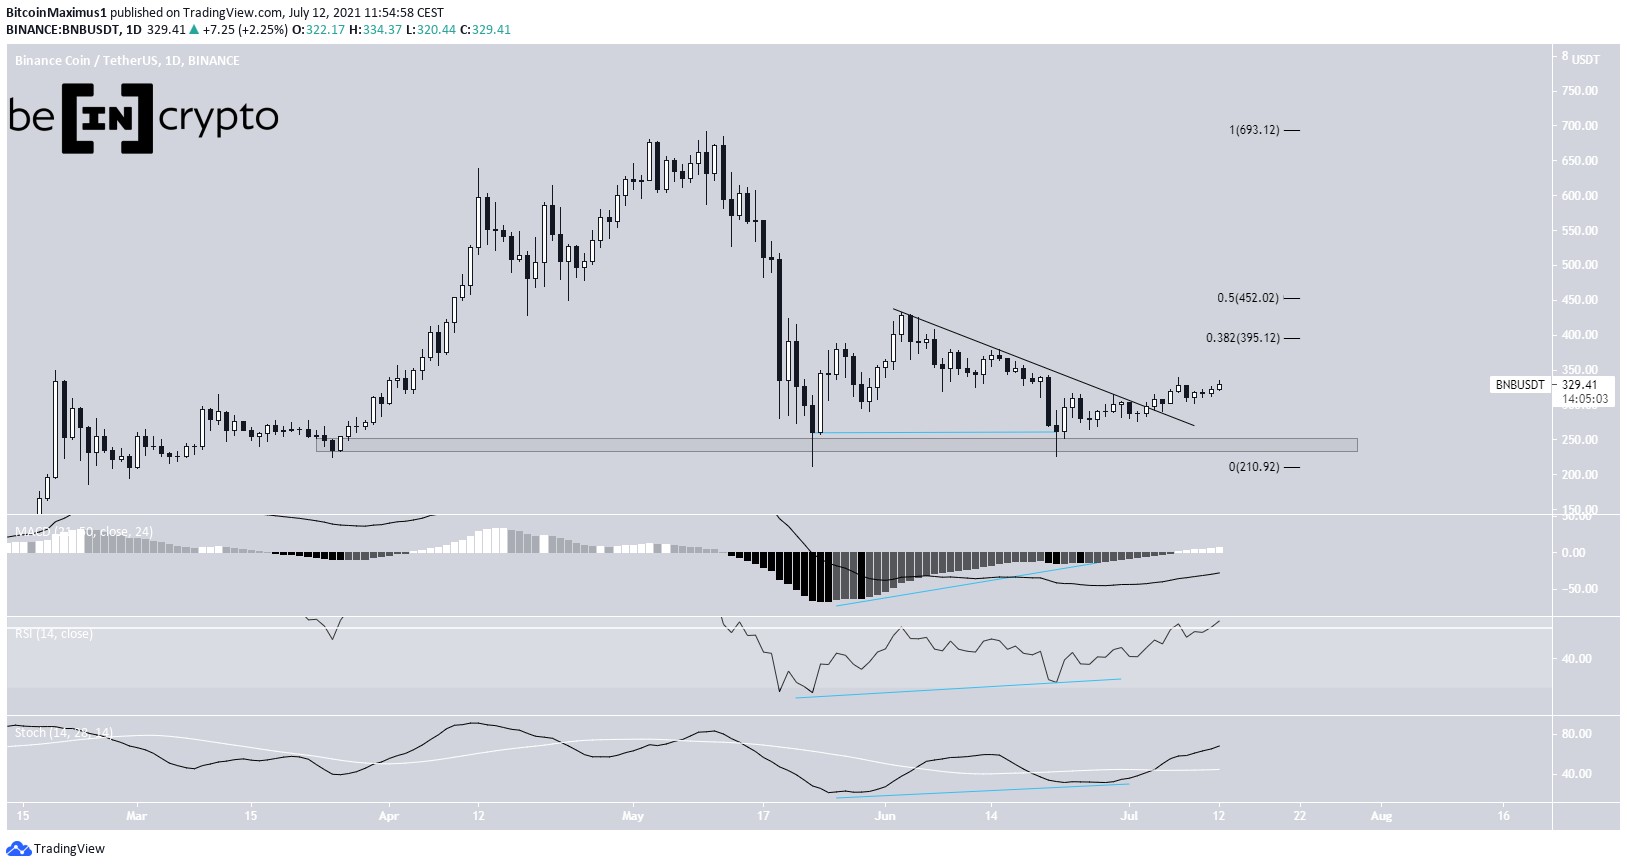
Binance Coin (BNB) has completed a double bottom pattern and broke out from a descending resistance line after.
BNB is currently following a short-term ascending support line and trading above the $315 horizontal support area.
Binance Coin double bottom leads to breakout
On May 23 and June 22, BNB completed a double bottom pattern inside the $240 horizontal support area. The pattern was combined with bullish divergences in the MACD, RSI, and Stochastic oscillator.
On July 3, it managed to break out from a descending resistance line. So far, it has reached a local high of $340 on July 7.
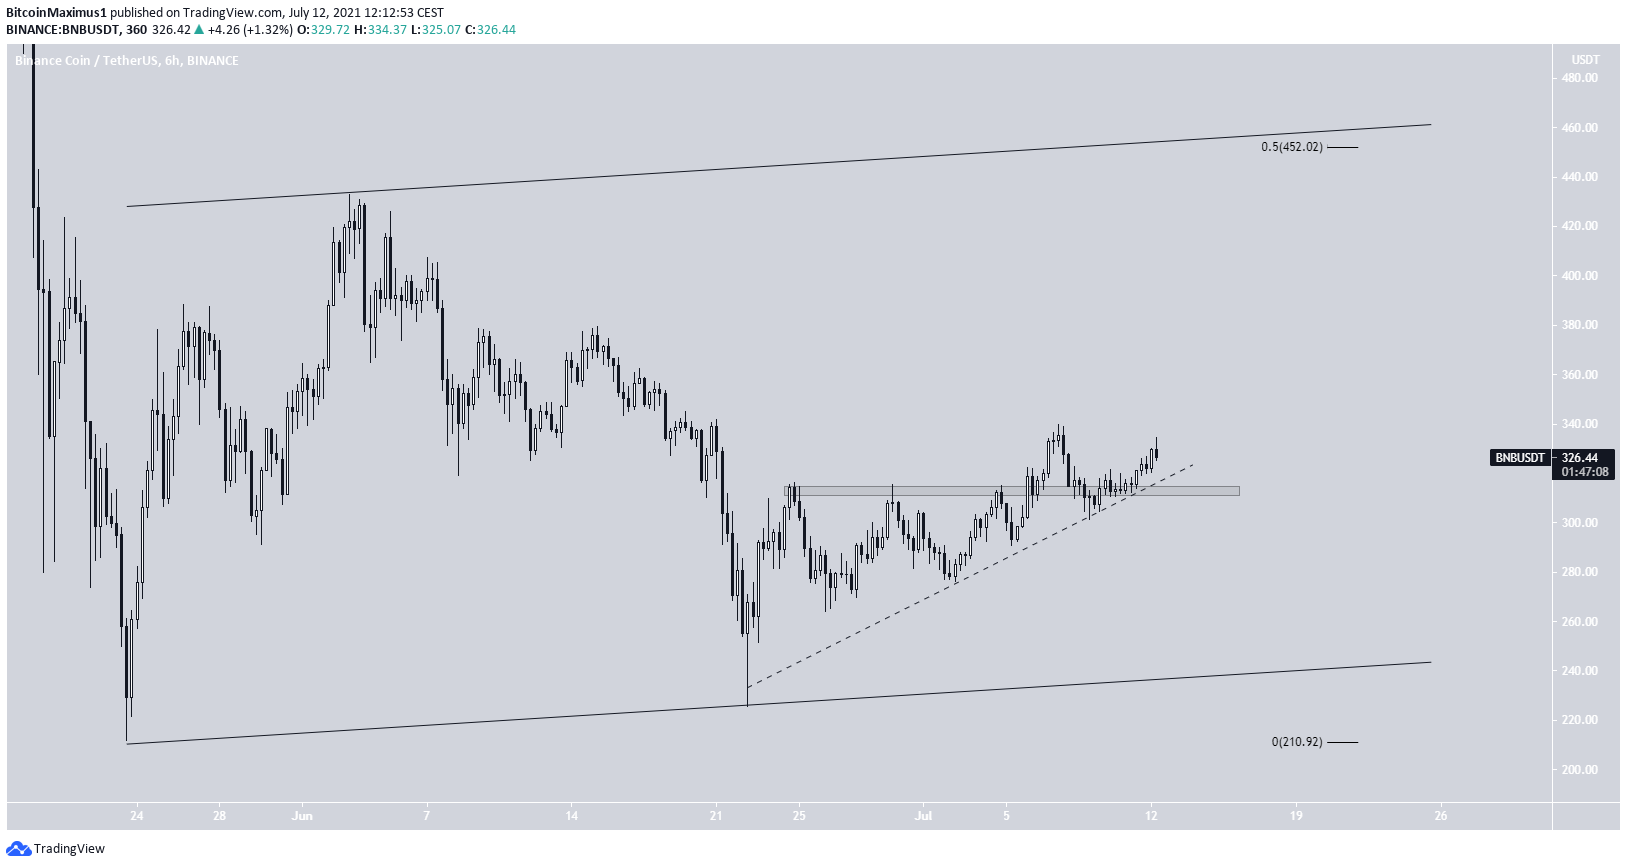
The closest resistance levels are found at $395 and $452. These targets are the 0.382 and 0.5 Fib retracement resistance levels.
Short-term movement
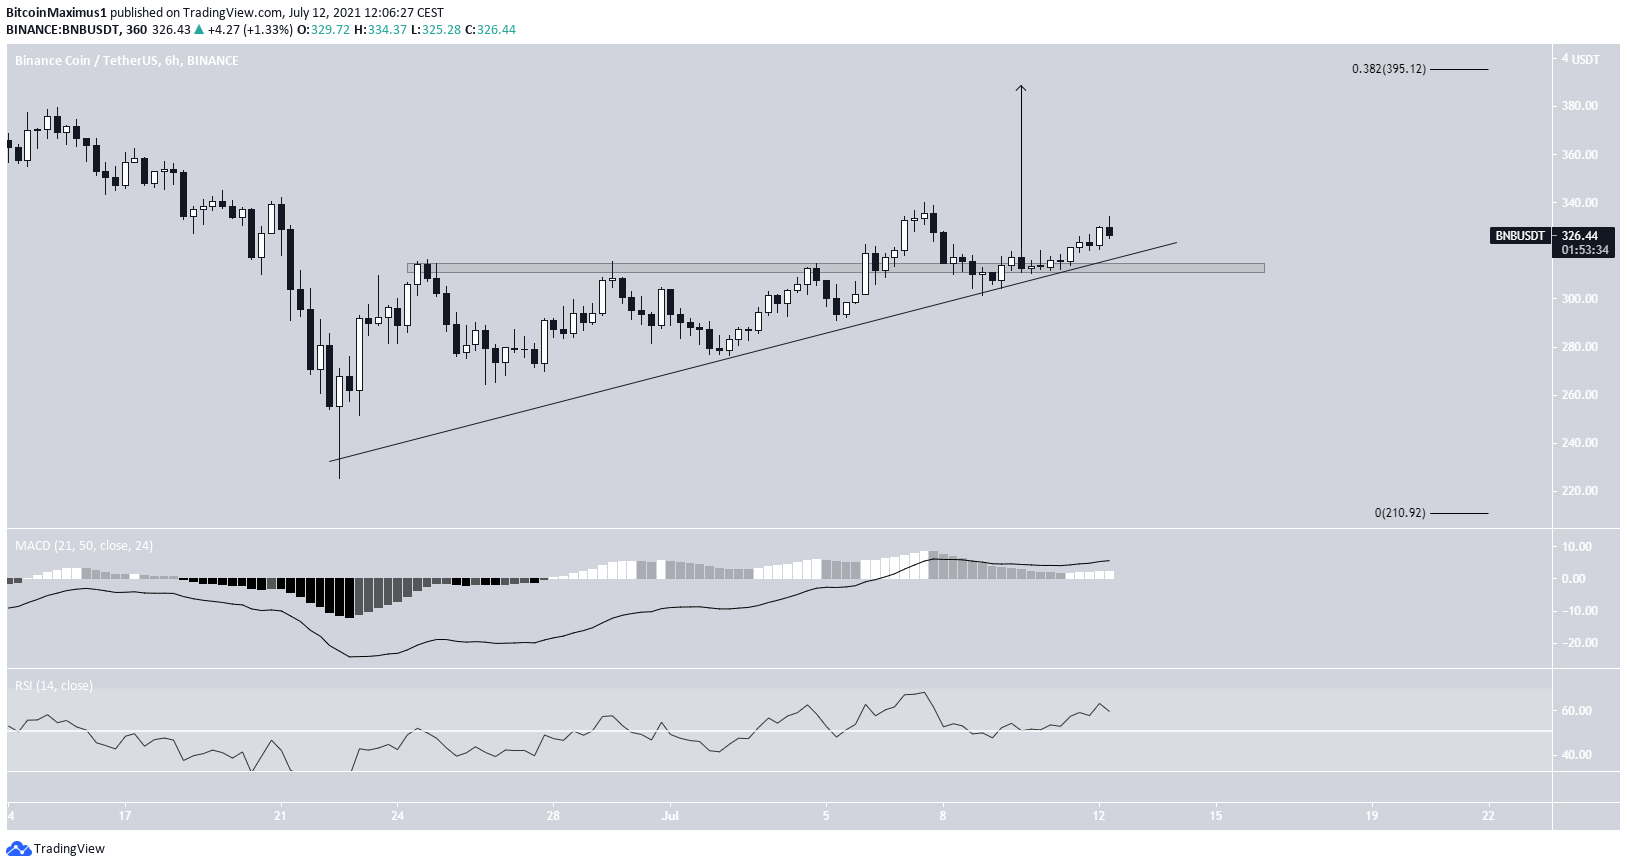
Cryptocurrency trader @TradingTank outlined a BNB chart, stating that it’s in the process of breaking out from a symmetrical triangle. The ensuing upward movement would take it to $380.
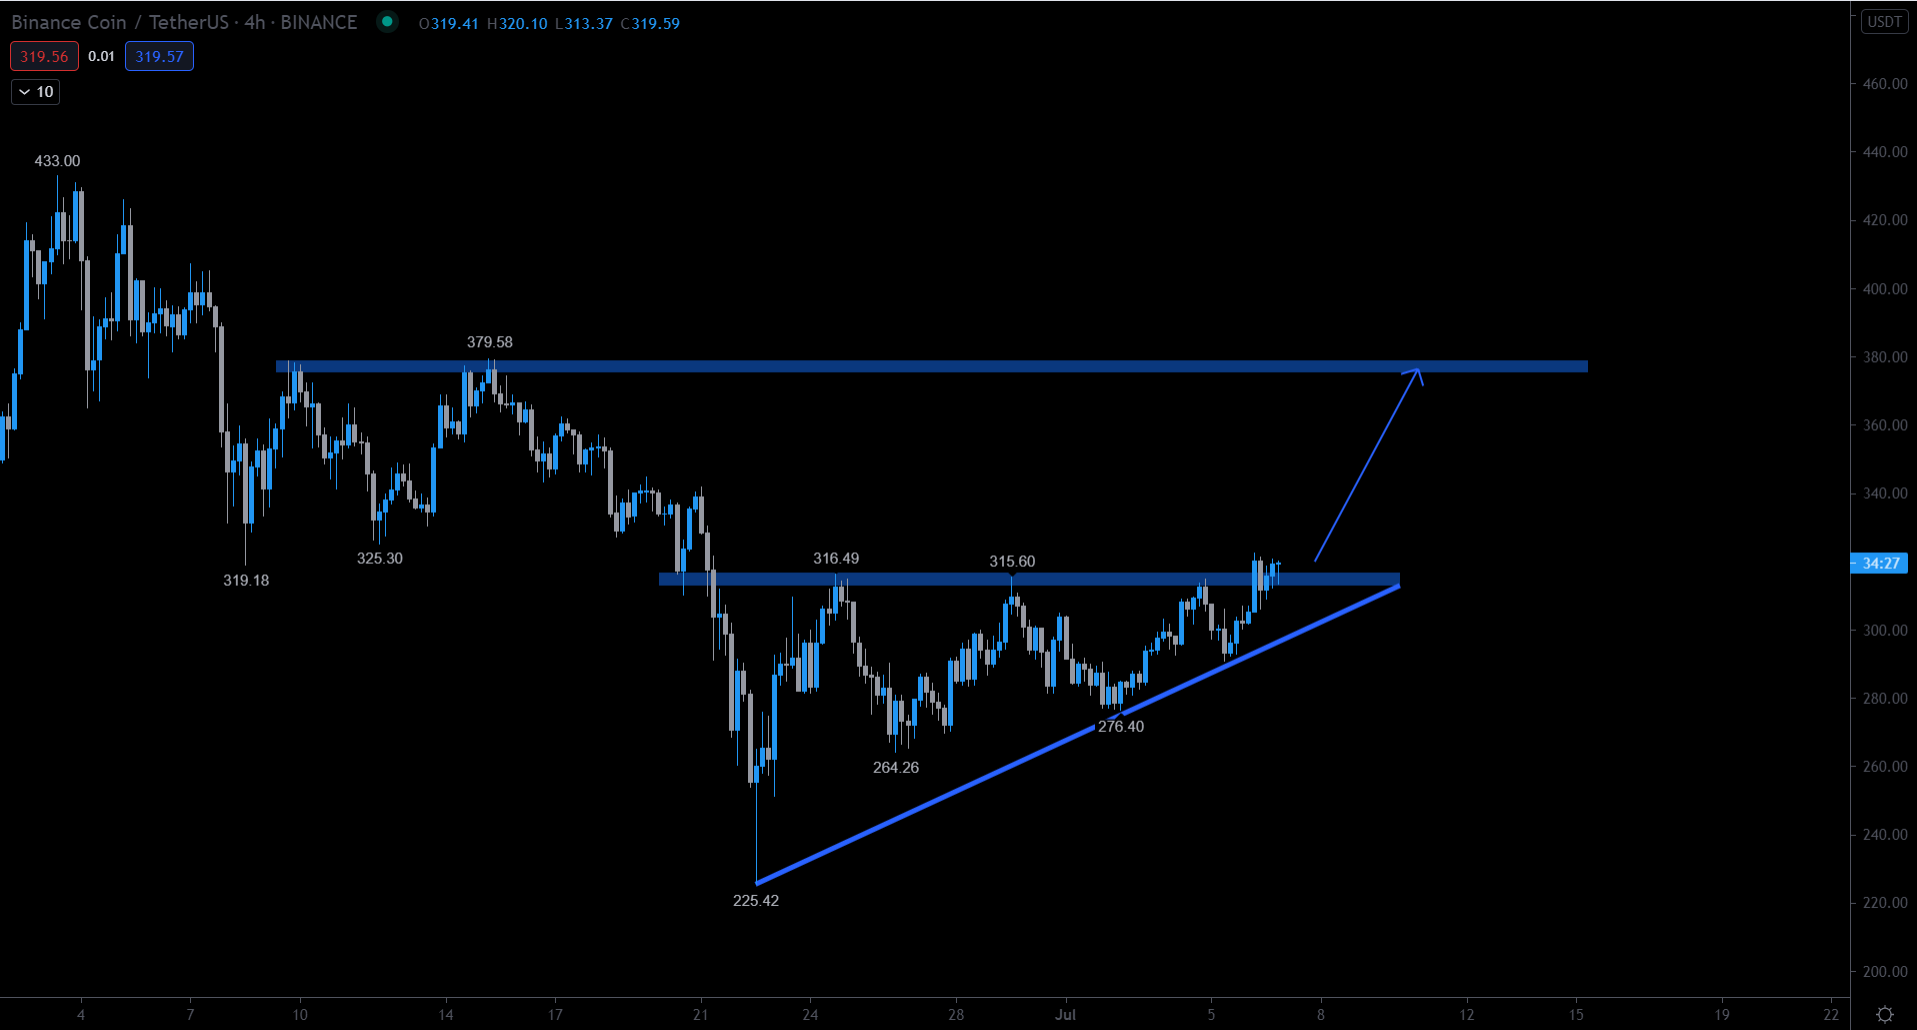
Since the tweet, BNB has broken out from the $315 horizontal resistance area, and validated it as support after. In addition, it’s following an ascending support line, though its slope is not entirely clear due to the long lower wick made on June 22.
A movement that travels the entire height of the pattern would take the token to the $395 resistance area.
Both the MACD and RSI support the continuation of the upward movement. Therefore, the short-term trend remains bullish as long as BNB is trading above the $315 horizontal area and the ascending support line.
If the entire movement since May 19 is an A-B-C corrective structure, BNB could reach the $452 resistance area before decreasing.
This would give waves A:C a 1:1 ratio and also reach the resistance line of an ascending parallel channel.
BNB/BTC
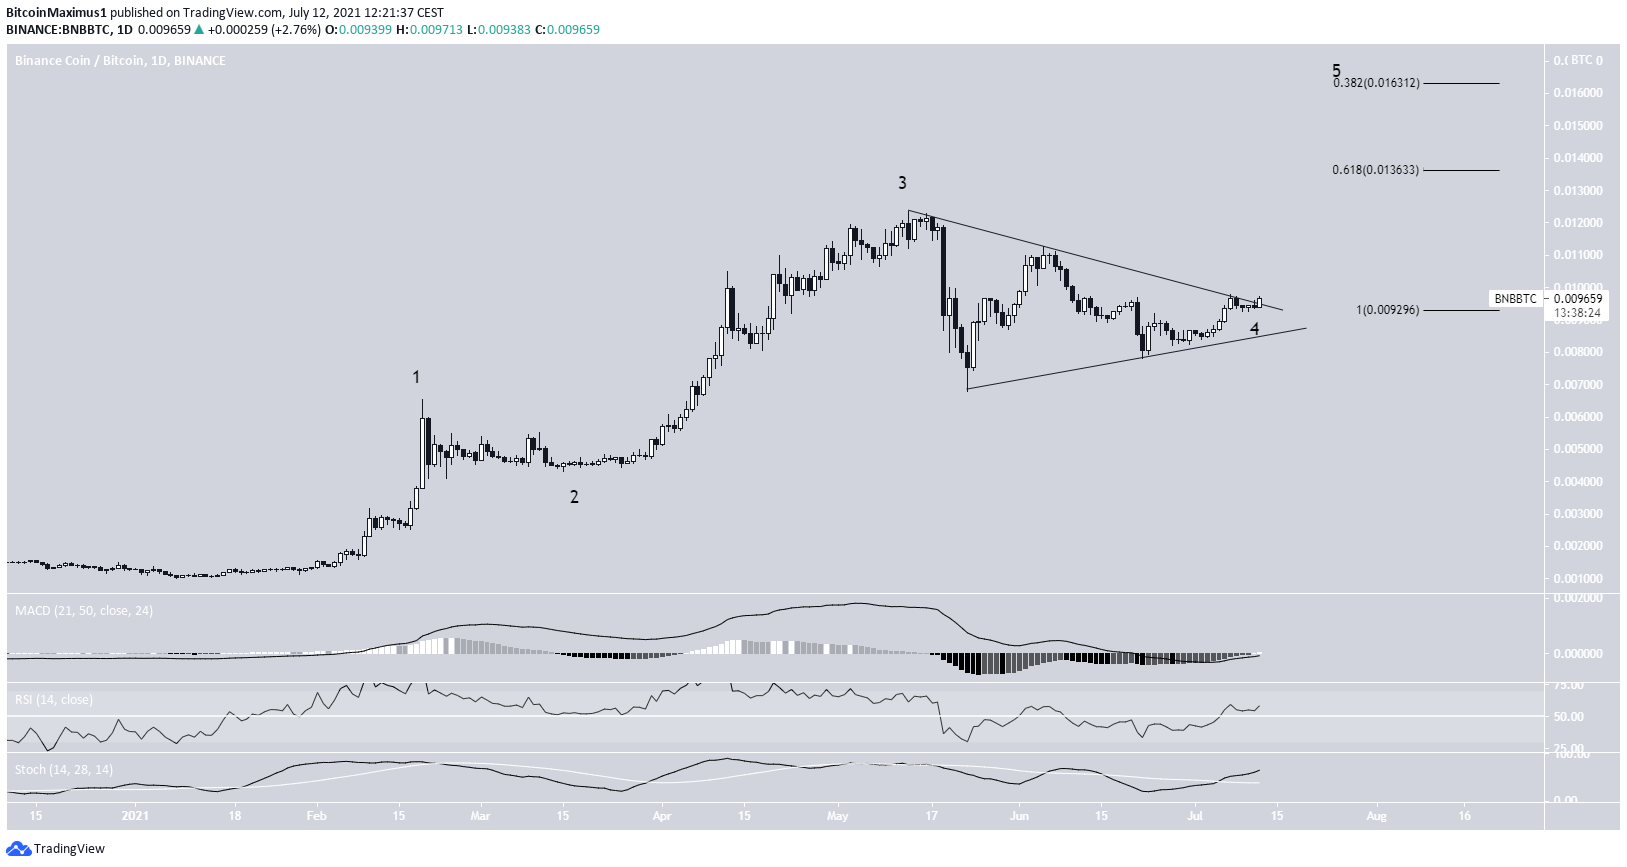
BNB/BTC has been trading inside a symmetrical triangle since reaching an all-time high of ₿0.0123 on May 13. While this is often considered a neutral pattern, it’s coming after an upward move. Therefore, a breakout would be more likely.
Furthermore, technical indicators are bullish. The MACD is nearly positive, the RSI is above 50, and the Stochastic oscillator has made a bullish cross.
It’s possible that the pattern is part of the fourth wave of a five wave bullish impulse.
The next potential targets would be found at ₿0.013 and ₿0.016. The are found using a Fib projection on waves 1-3.
For BeInCrypto’s latest BTC (BTC) analysis, click here.
The post Binance Coin (BNB) Breaks Out After Bullish Pattern Formation appeared first on BeInCrypto.


