Bitcoin analysis – Investors Await SEC Decision on Spot Bitcoin ETFs
4 min readAfter the bullish price movement in the previous week, which in the meantime pushed the Bitcoin price to a new annual high of 31,443 US dollars, the buyer side has not yet been able to initiate a trend-following movement northwards. Although the bulls initially fended off a sell-off in the wake of the SEC’s renewed concerns about Bitcoin spot ETF approval last week, the BTC price seems increasingly stuck. During Bitcoin futures open interest according to Coinglass, has continued to increase in recent weeks, activity on the spot market has recently been declining. The price movements in the last few days seem to have been largely determined by futures traders, while investors on the spot market are exercising restraint for the time being. Although Blackrock, similar to Fidelity before it, has a submitted revised Bitcoin ETF application, Bitcoin investors currently seem to prefer to wait for a definitive commitment from the Security and Exchange Commission. The fact that Bitcoin dominance consolidated by two percent after a remarkable rise to the resistance at 52.18 percent and investors used Bitcoin’s sideways phase to switch to the altcoin sector confirms investors’ wait-and-see attitude.

Bitcoin: Bullish price targets for the coming trading weeks
Bullish price targets: 31.050 USD/31.443 USD, 31,755 USD, 32.403 USD/32.938 USD 34,748 USD/34,934 USD, 35,561 USD, 36,587 USD/37,452 USD
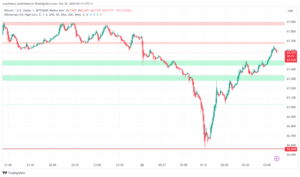
The buy side has been struggling at the $31,050 to $31,443 resistance zone for the past few days. In the short term, the focus is again on the yellow support area between US$ 30,615 and US$ 30,404. Here the EMA200 can be found in the hourly chart as the first important support. As long as Bitcoin does not sustainably slide below this moving average line, there is still a good chance that the buyer camp will attack again. A temporary setback in the direction of last Friday’s price low of 29,417 US dollars would also be manageable in order to gain new momentum for the next attempt to break out.
If the Bitcoin price can dynamically break out above the year-to-date high, the next technical chart hurdle awaits at US$ 31,755. If this price level is also sustainably overcome, a directional decision will be made in the target area between US$ 32,403 and US$ 32,938. Profit-taking by the buyer side must be planned for here.
It is unlikely that buyers will have the strength to immediately send Bitcoin further north without a price pullback. Only if the bulls succeed in a sustained breakout above the massive red resist zone would the path be clear for a follow-up move to the next relevant target area of horizontal resistance and the 161 Fibonacci extension of the current move between $34,748 and $34,934. If this area is also recaptured without any significant setbacks, Bitcoin should be able to advance to the brown resistance zone between US$ 36,587 and US$ 37,452 in the medium term.
Bitcoin: Bearish Bitcoin price targets for the coming trading weeks
Bearish price targets: $30,615/$30,404, $30,060/$29,847 $29,433, $29,185, $28,529, $28,063 $27,560/$27,187, $26.809/$26.657, $26,311/$26,074, $25,351/$24,748
Whether it is currently the strength of the bears that is preventing a rise towards new highs for the year or the abstinence of the herd of bulls is difficult to determine at the moment. The sell-side has also failed in its attempt to sell BTC back below the yellow support zone towards the psychological $30,000 mark over the past few days. However, the bears must aim to dynamically push Bitcoin below $29,847 towards last week’s lows.
Between $29,433 and $29,185 is the first short-term target area. Only a sustained fall below the pink support area would turn the chart image in favor of the sellers. If Bitcoin breaks below this zone at the end of the day, the support from the Supertrend and EMA50 (orange) in the daily chart at 28,529 US dollars comes into focus. If the high of May 29 at 28,473 US dollars is undercut, a directional decision can be planned at 28,063 US dollars at the latest. The bulls should already be back at this point.
A break to the south will expand the consolidation towards the green support zone between $27,560 and $27,187. Again, in this area, plans are to be made with clear resistance on the part of the buyers. If, contrary to expectations, the Bitcoin price continues to show weakness, the BTC price could be passed through to the old breakout zone between USD 26,809 and USD 26,657. The maximum bearish price target in the form of the purple support area between $26,311 and $26,074 would be within reach again. The moving average of the last 200 trading days (EMA200) (blue) is also currently running here.
Looking at the indicators
The RSI as well as the MACD still show buy signals in the daily chart, but seem a bit crowded. A price consolidation would therefore be healthy in view of the indicators. If the RSI indicator dips back into the neutral zone between 55 and 45 on the 4-hour chart and thus switches back to neutral, the probability of a price consolidation in Bitcoin would further increase.
On a weekly basis, the RSI indicator has shown a stable buy-signal since its bullish breakout to the north and still has room to rise at the 63 level. The same applies to the MACD, which also has an active logn signal.
Glassnode is a leading blockchain data and intelligence platform. Offering the most comprehensive library of on-chain and financial metrics, they provide a holistic and contextual view of crypto markets through understandable and actionable insights.
The data and statistics provided by Glassnode are trusted by the world’s leading investors, hedge funds, banks, asset managers and crypto companies.


