Table of Contents
Bitcoin (BTC) dropped significantly on Feb. 22, reaching a local low of $47,622. While it has recovered some since then, BTC is still barely treading water above $50,000.
Despite the considerable drop, it’s likely that this is a short-term correction, Bitcoin is expected to make another new high after.
Bitcoin Attempts to Find Support
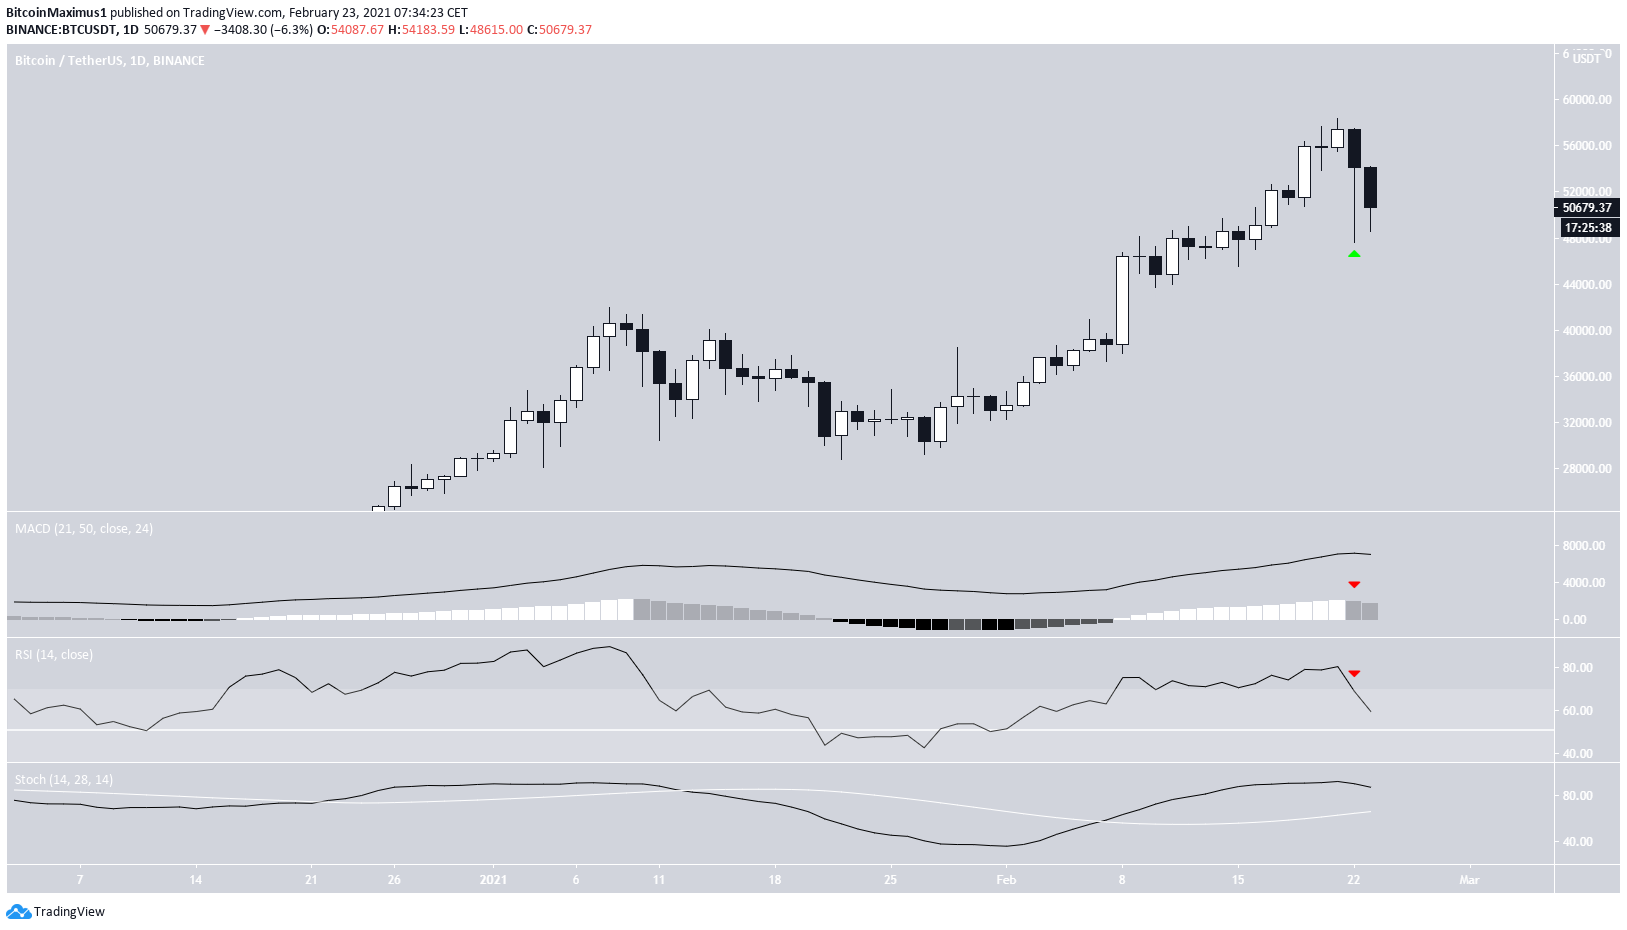
Bitcoin decreased considerably on Feb. 22, dropping all the way to a low of $47,662. The lower price levels got bought up quickly, creating a long lower wick (green arrow). However, BTC resumed its descent on Feb. 23, nearly falling below the lows from Feb. 22.
Technical indicators are showing some weakness, as is evidenced by the lower momentum bar in the MACD and the RSI cross below 70. These signals are not necessarily sufficient enough to confirm a bearish reversal. Depending on the daily price close, it’s likely that the RSI will generate some type of hidden bullish divergence — a common sign of trend continuation.
Future Movement
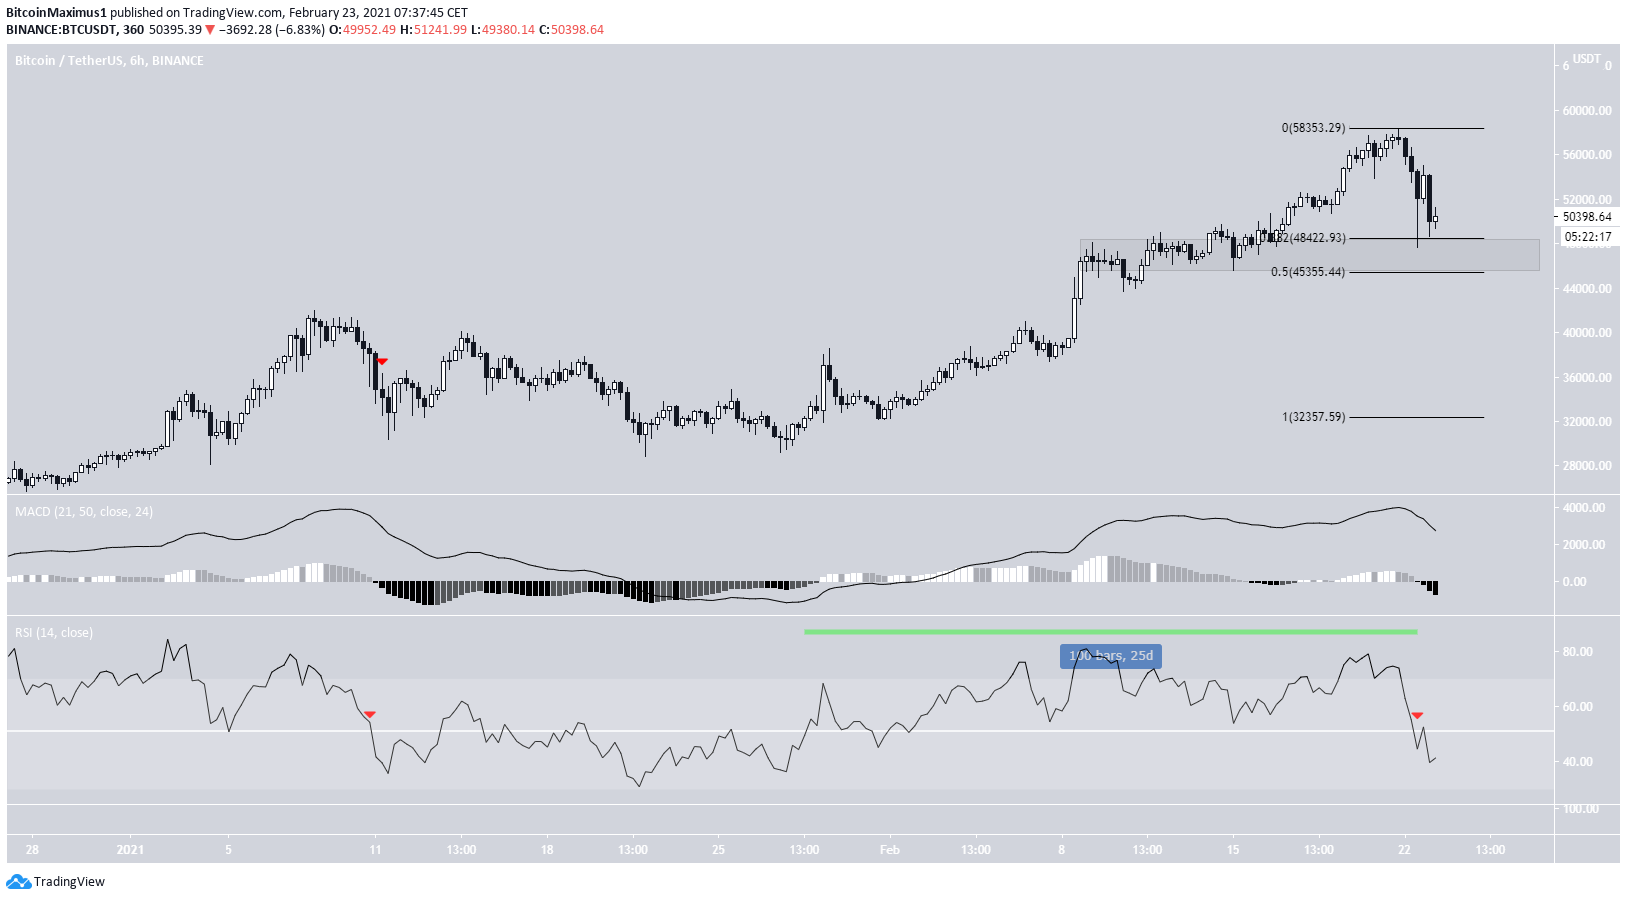
The six-hour chart shows that BTC has tagged the 0.382 Fib retracement level at $48,422. There is also support back at the $45,355 level (0.5 Fib retracement level).
After a 25-day period above the 50-line, the RSI has finally dropped below 50. This could be a sign of a trend reversal, similar to what occurred on Jan. 10, 2021.
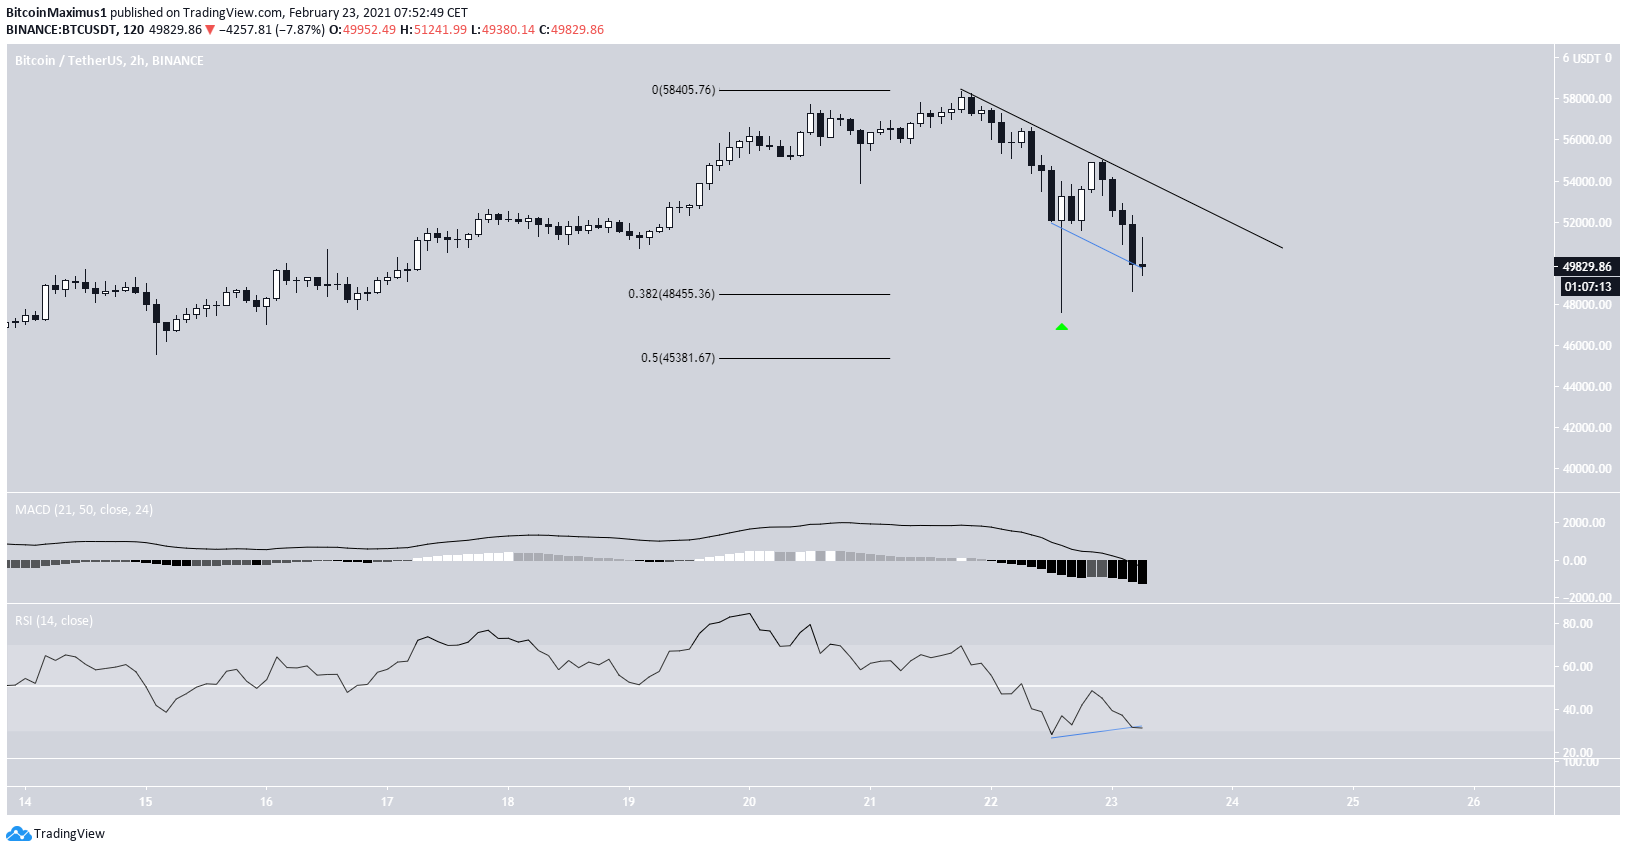
The two-hour chart shows some signs of a bullish reversal in the form of a bullish divergence in the RSI and a very long bullish hammer candle (green arrow).
Until BTC manages to break out above the short-term descending resistance line, we cannot consider the short-term correction complete.
BTC Wave Count
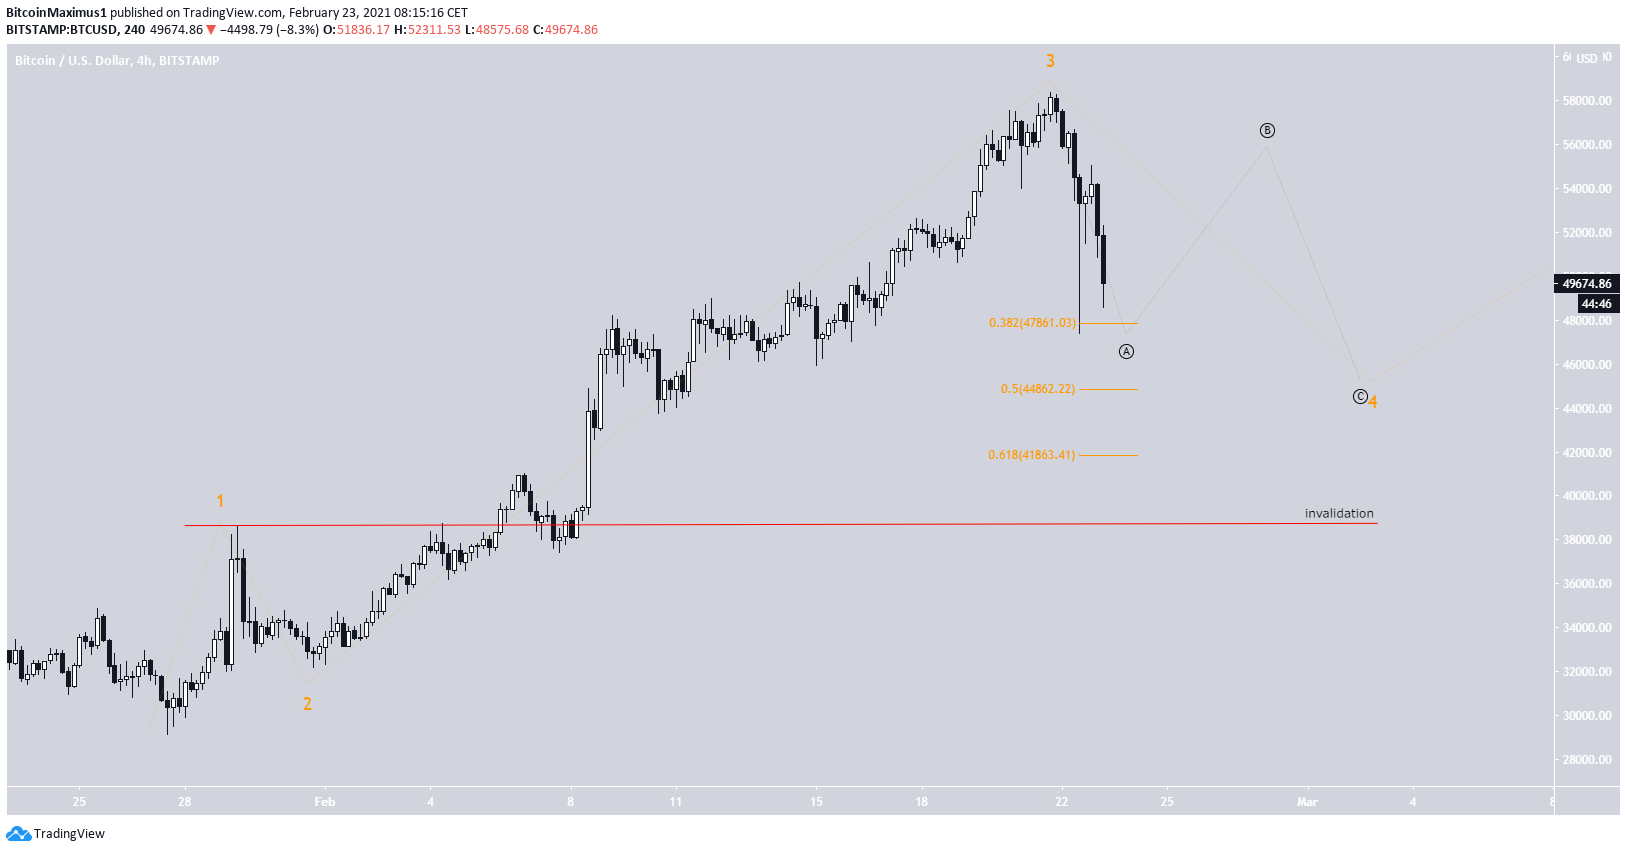
The wave count suggests that BTC is in a corrective wave four (shown in orange) of a bullish impulse that began with the Jan. 28 lows at $29,000. After this move is completed, another high near $60,000 is expected.
The sub-wave count is shown in black and suggests that BTC has either completed or is nearing the end of sub-wave A. This is because it has already tagged the 0.382 Fib support.
While it’s possible that BTC continues to drop straight toward the 0.5 Fib support, it’s expected to bounce soon and complete the B sub-wave first.
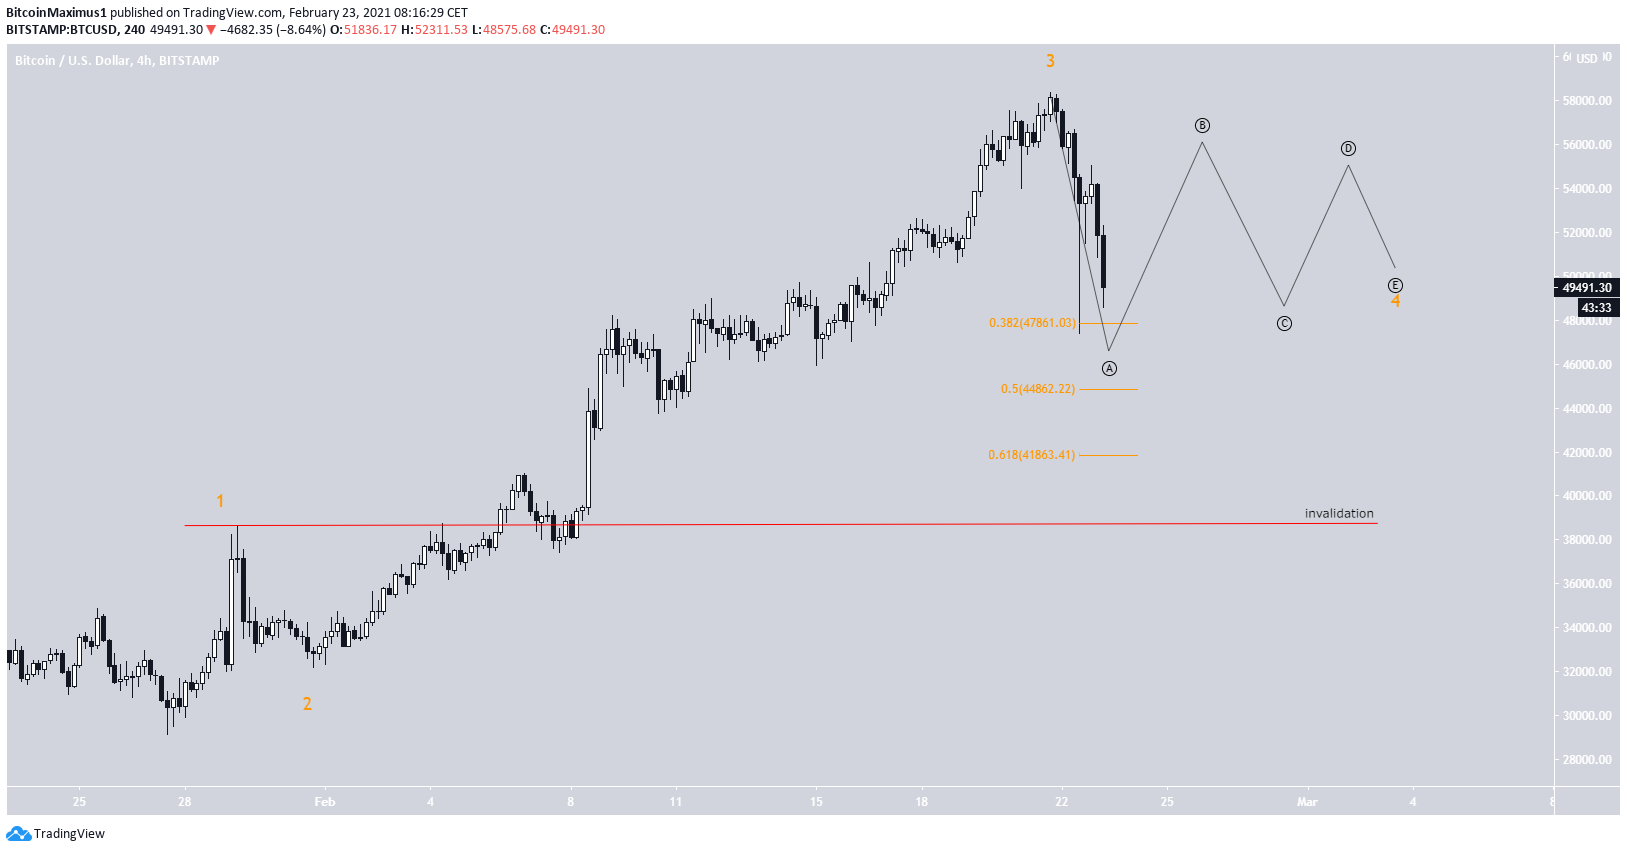
The more bullish scenario would have this developing into a fourth wave triangle. In this case, the current low would serve as the actual lowest price reached.
However, at the current time, we cannot determine the shape of the rest of the correction.
Conclusion
Despite the ongoing drop, Bitcoin is expected to find support between the 0.382 and 0.5 Fib retracement support levels before bouncing upwards.
It’s likely that BTC still has another high to go before reaching its local top.
For BeInCrypto’s previous Bitcoin (BTC) analysis, click here.
The post Bitcoin Drops Below $50,000 — Will a Steeper Correction Follow? appeared first on BeInCrypto.


