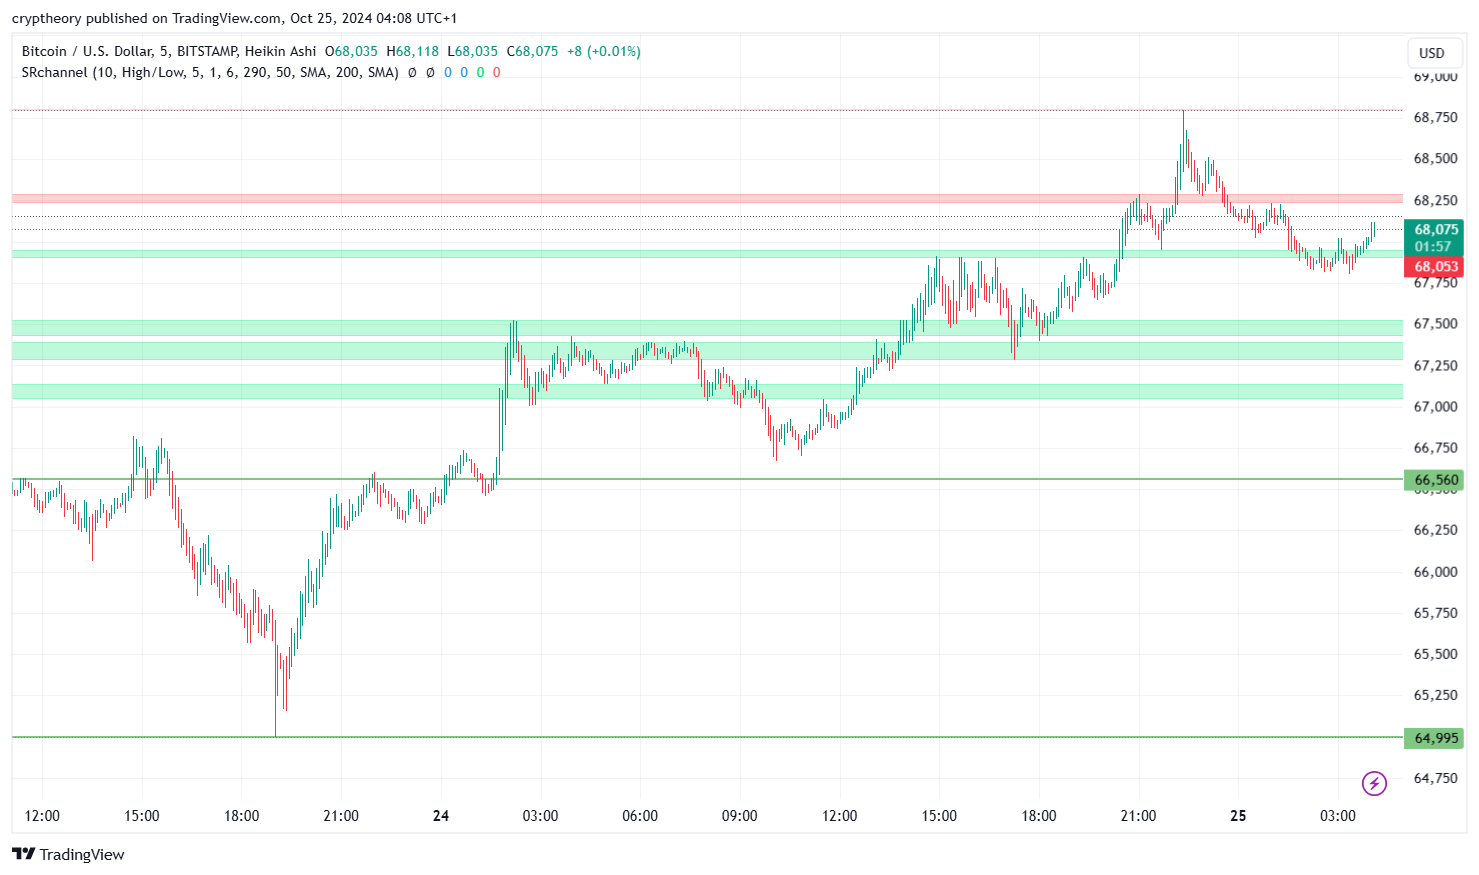
BTC recently got through resistance side structure, which was current for 2 weeks and was achieved maximum $ 32,200. However, it is quite possible that this growing trend will only be short-lived and will not be significant for the long-term trend. Where is the target and levels of the nearest resistances located?
Last week we showed what target to follow in case the price breaks through the resistance of the sideway movement. The nearest target is a zone around $ 33,000, which means that growth is coming to an end. This target follows from resistance local maximum correction leg in which the price is located.
 Source: TradingView
BTC overcame resistance
The market price could theoretically go higher if growth was accompanied by increasing volumes. They have grown, but so far this is nothing special. In addition, RSI is in the short term in the overbought zone and will soon reach resistance which means that the formation of the local maximum is approaching.
In the long run, I still remain bullish and in the medium term bearish. On-chain metrics point to the possibility ongoing correction which could take several more months. The graph itself suggests this as well, and you need to realize that for now there was no trend reversal signal.


