Table of Contents
The BTC (BTC) price has been increasing since bouncing on March 25. It’s currently reapproaching the $60,000 level.
While BTC is expected to reach a new all-time high, a short-term retracement is likely prior to the final breakout.
BTC Nearing All-Time High
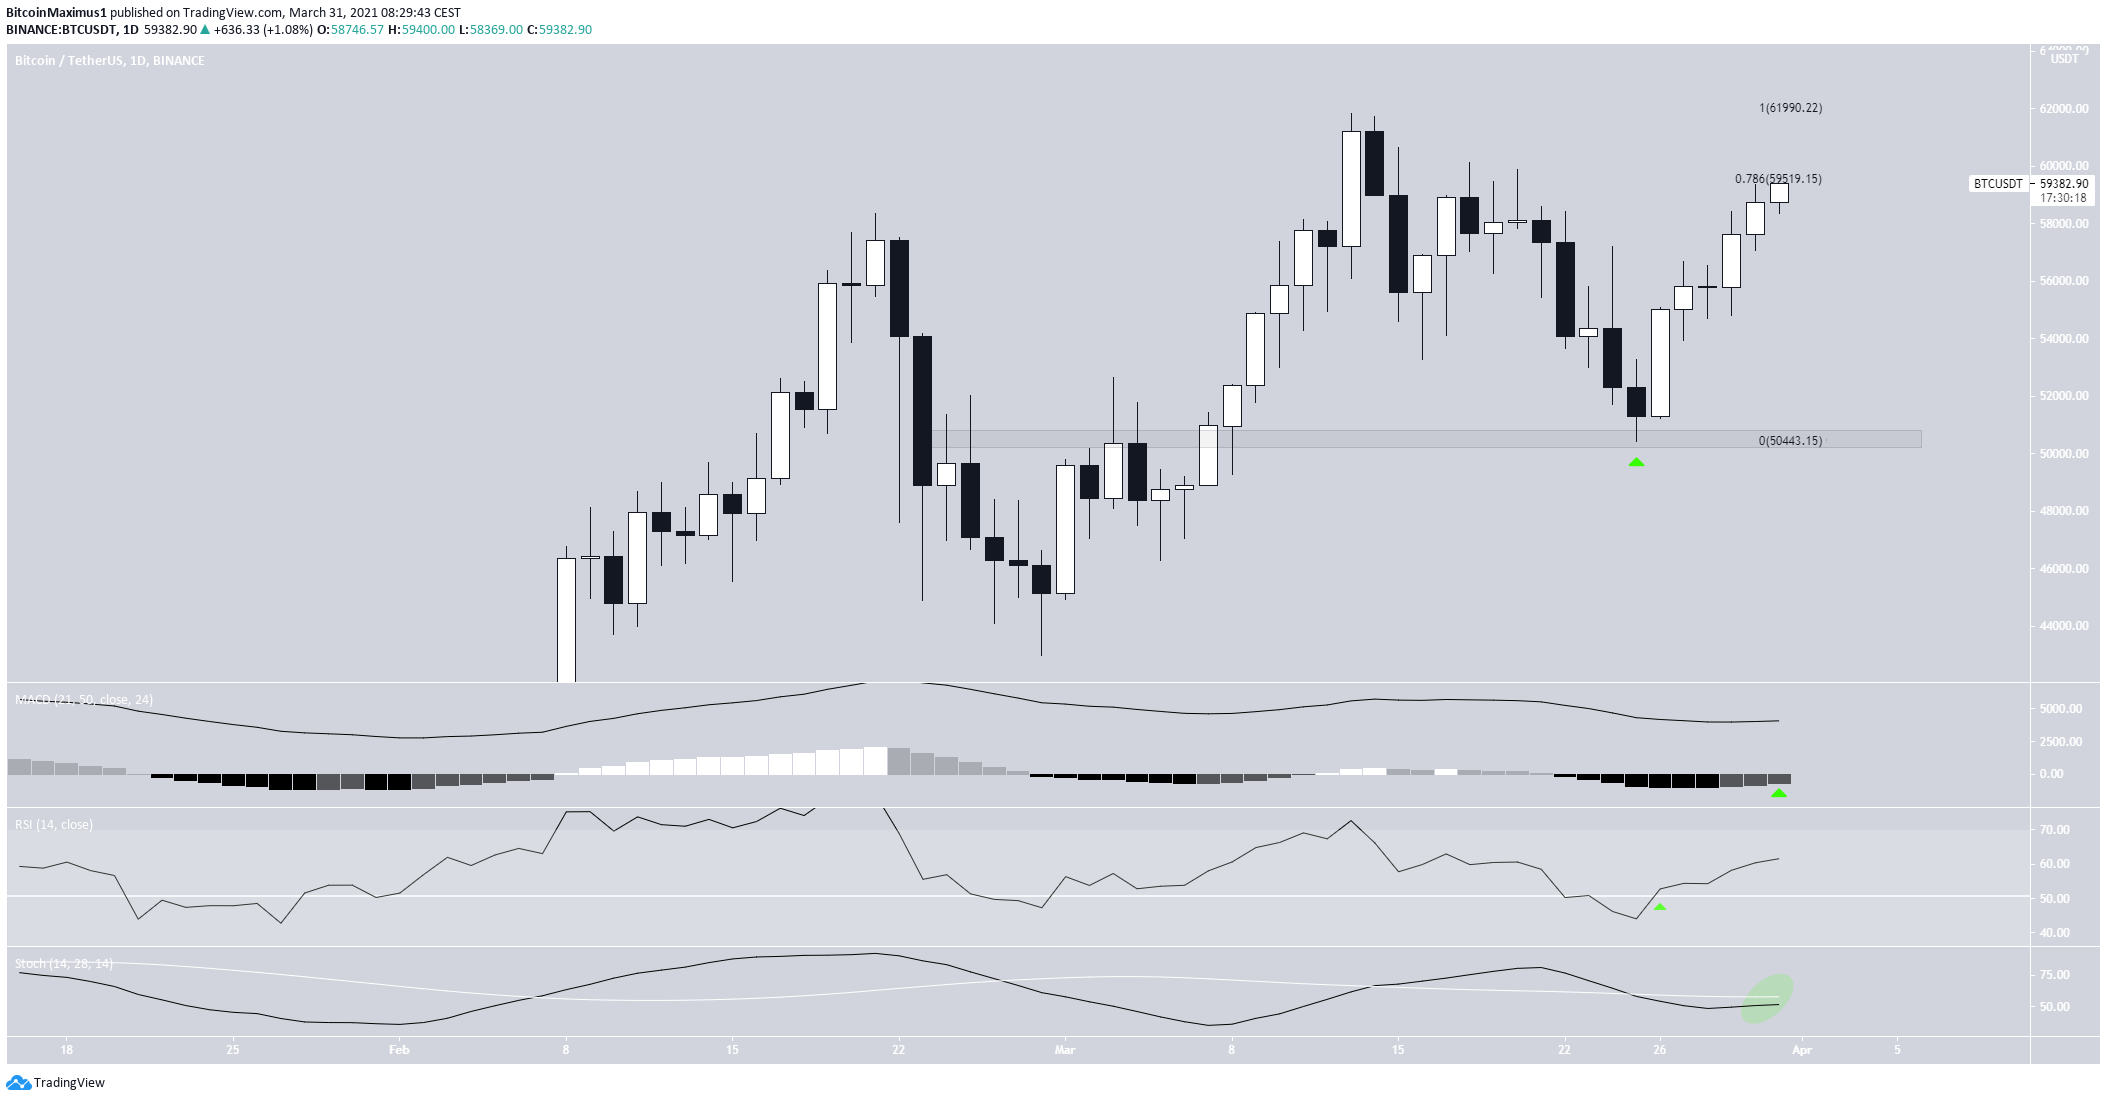
BTC has been increasing since bouncing on March 25. Since then, it’s reached a high of $59,800 on March 31.
Currently, the price is trading inside the $59,500 resistance area. This is the 0.786 Fib retracement level of the previous drop.
Technical indicators have turned bullish. The MACD has given a bullish reversal signal and the RSI has crossed above 50.
While the stochastic oscillator has yet to make a bullish cross, it’s very close to doing so.
Will It Break Out?
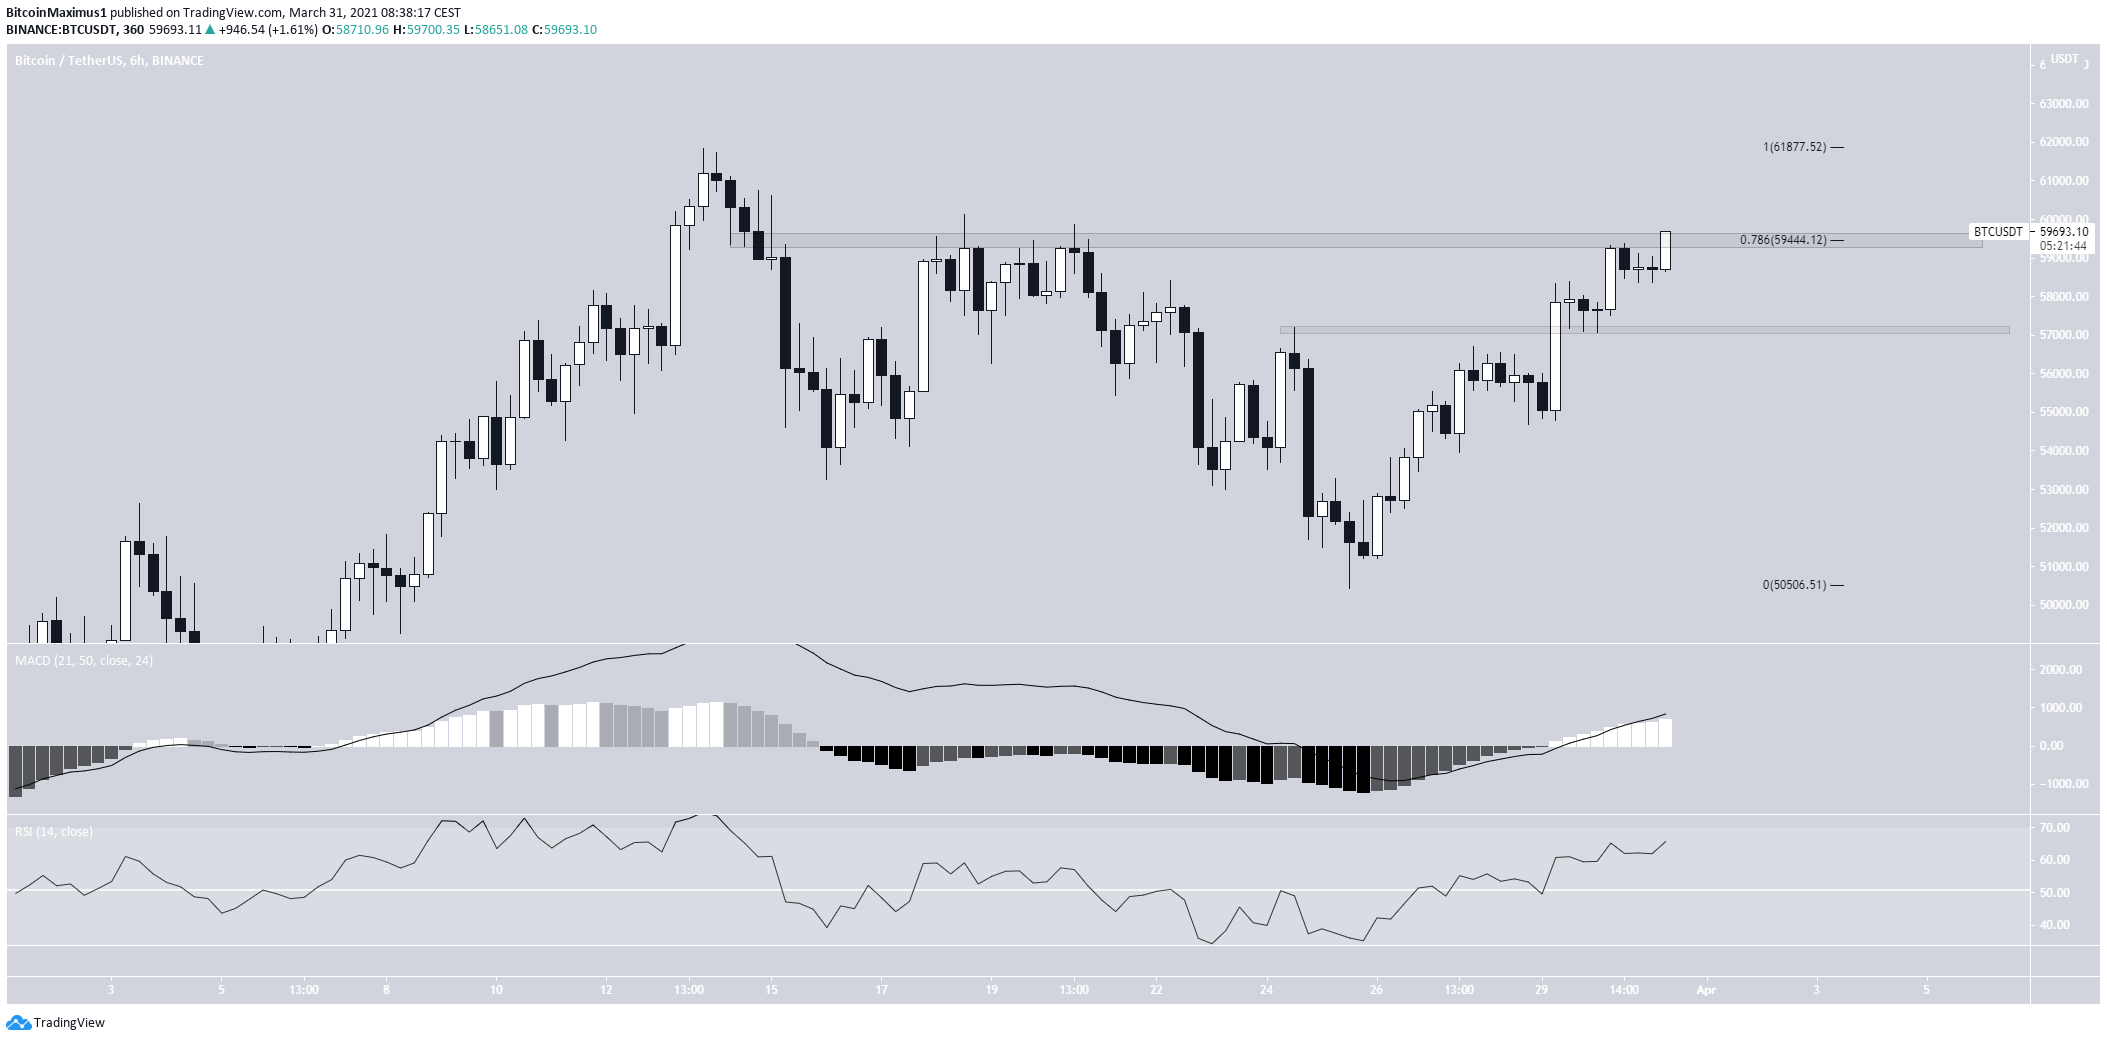
The six-hour chart shows that the $59,500 area is also a horizontal resistance level.
Both the MACD and RSI are bullish. Therefore, an eventual breakout from this area is expected.
The closest horizontal support level is found at $57,000.
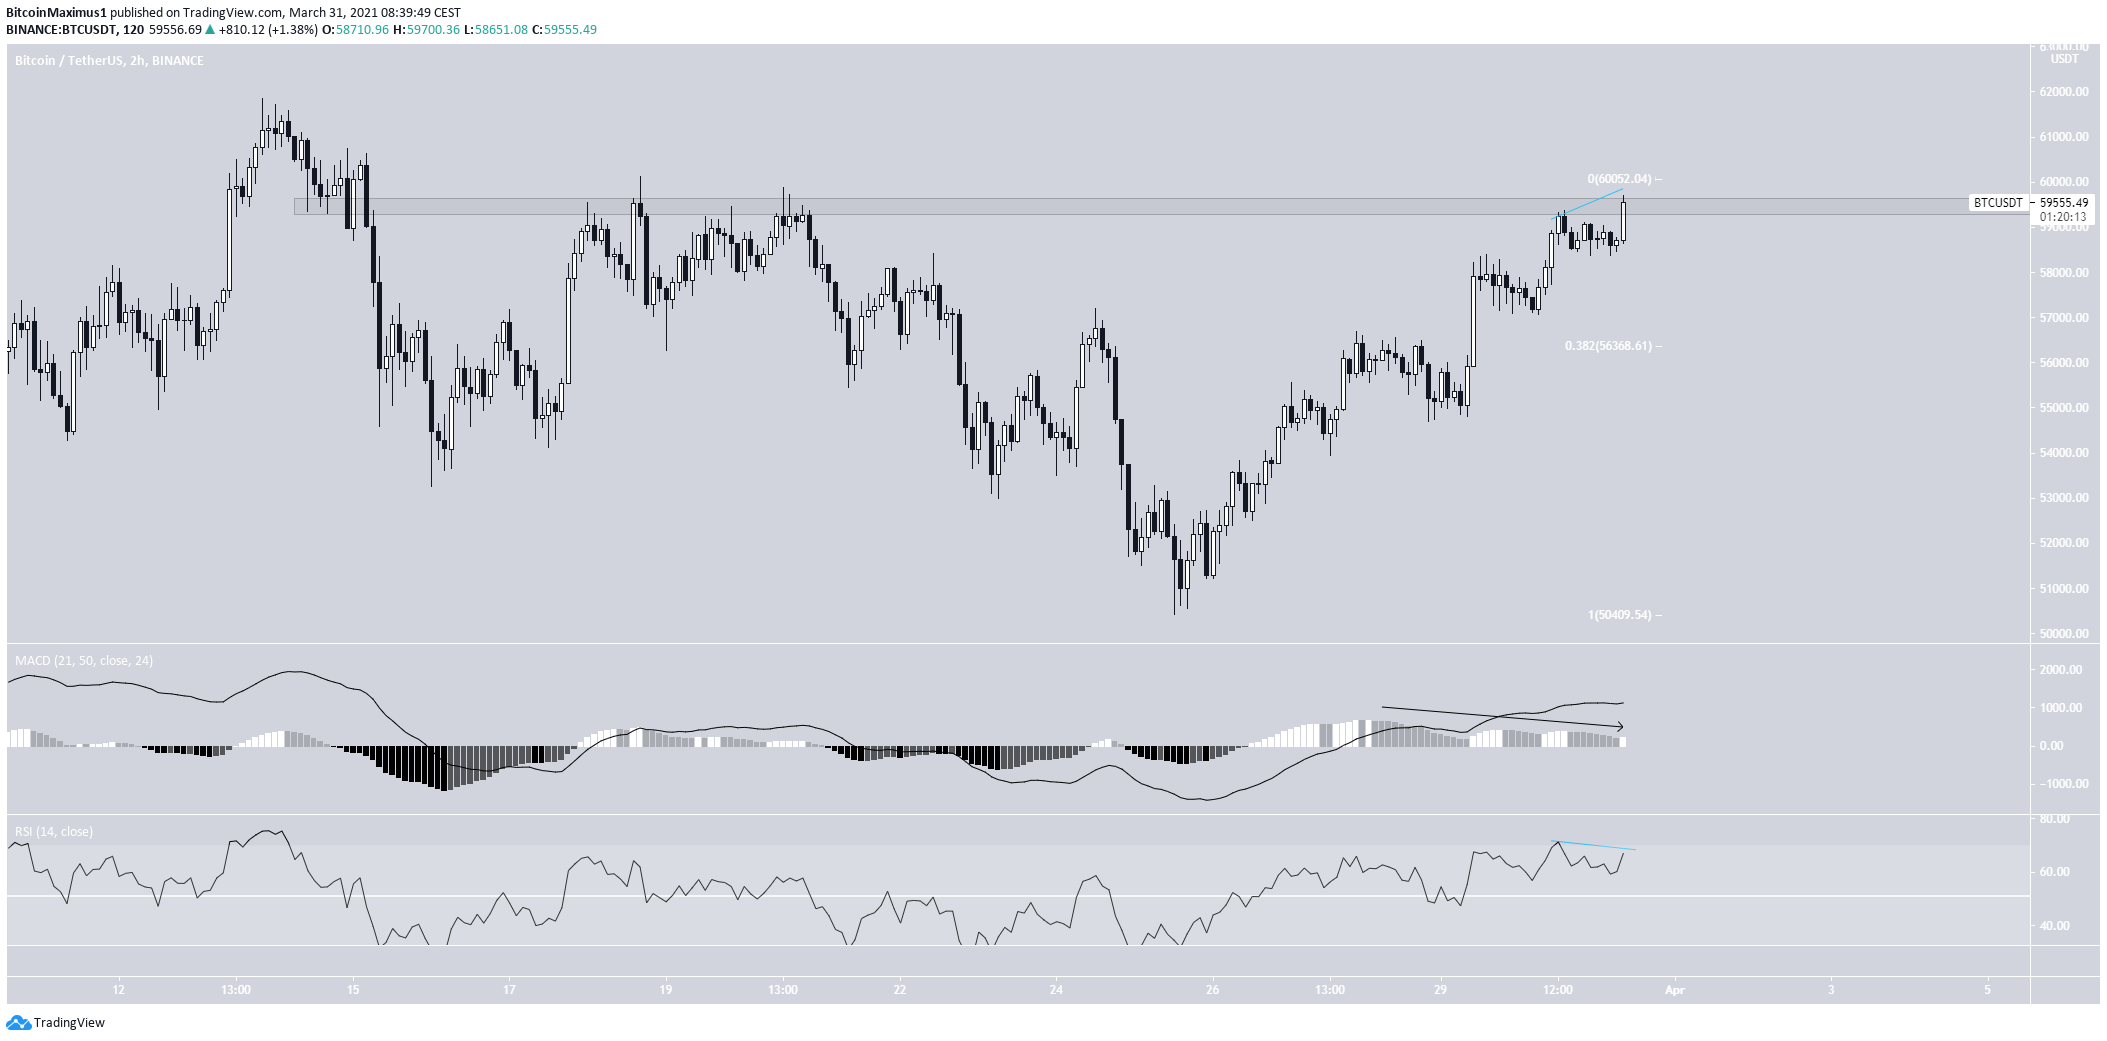
The two-hour chart shows the first signs of weakness.
The MACD has generated a triple bearish divergence. In addition, the RSI has generated some bearish divergence, though it’s still unconfirmed.
A retracement could depend on the exact value of the top. However, if the local top is reached near $60,000, the first Fib support level would be found at $56,500.
Wave Count
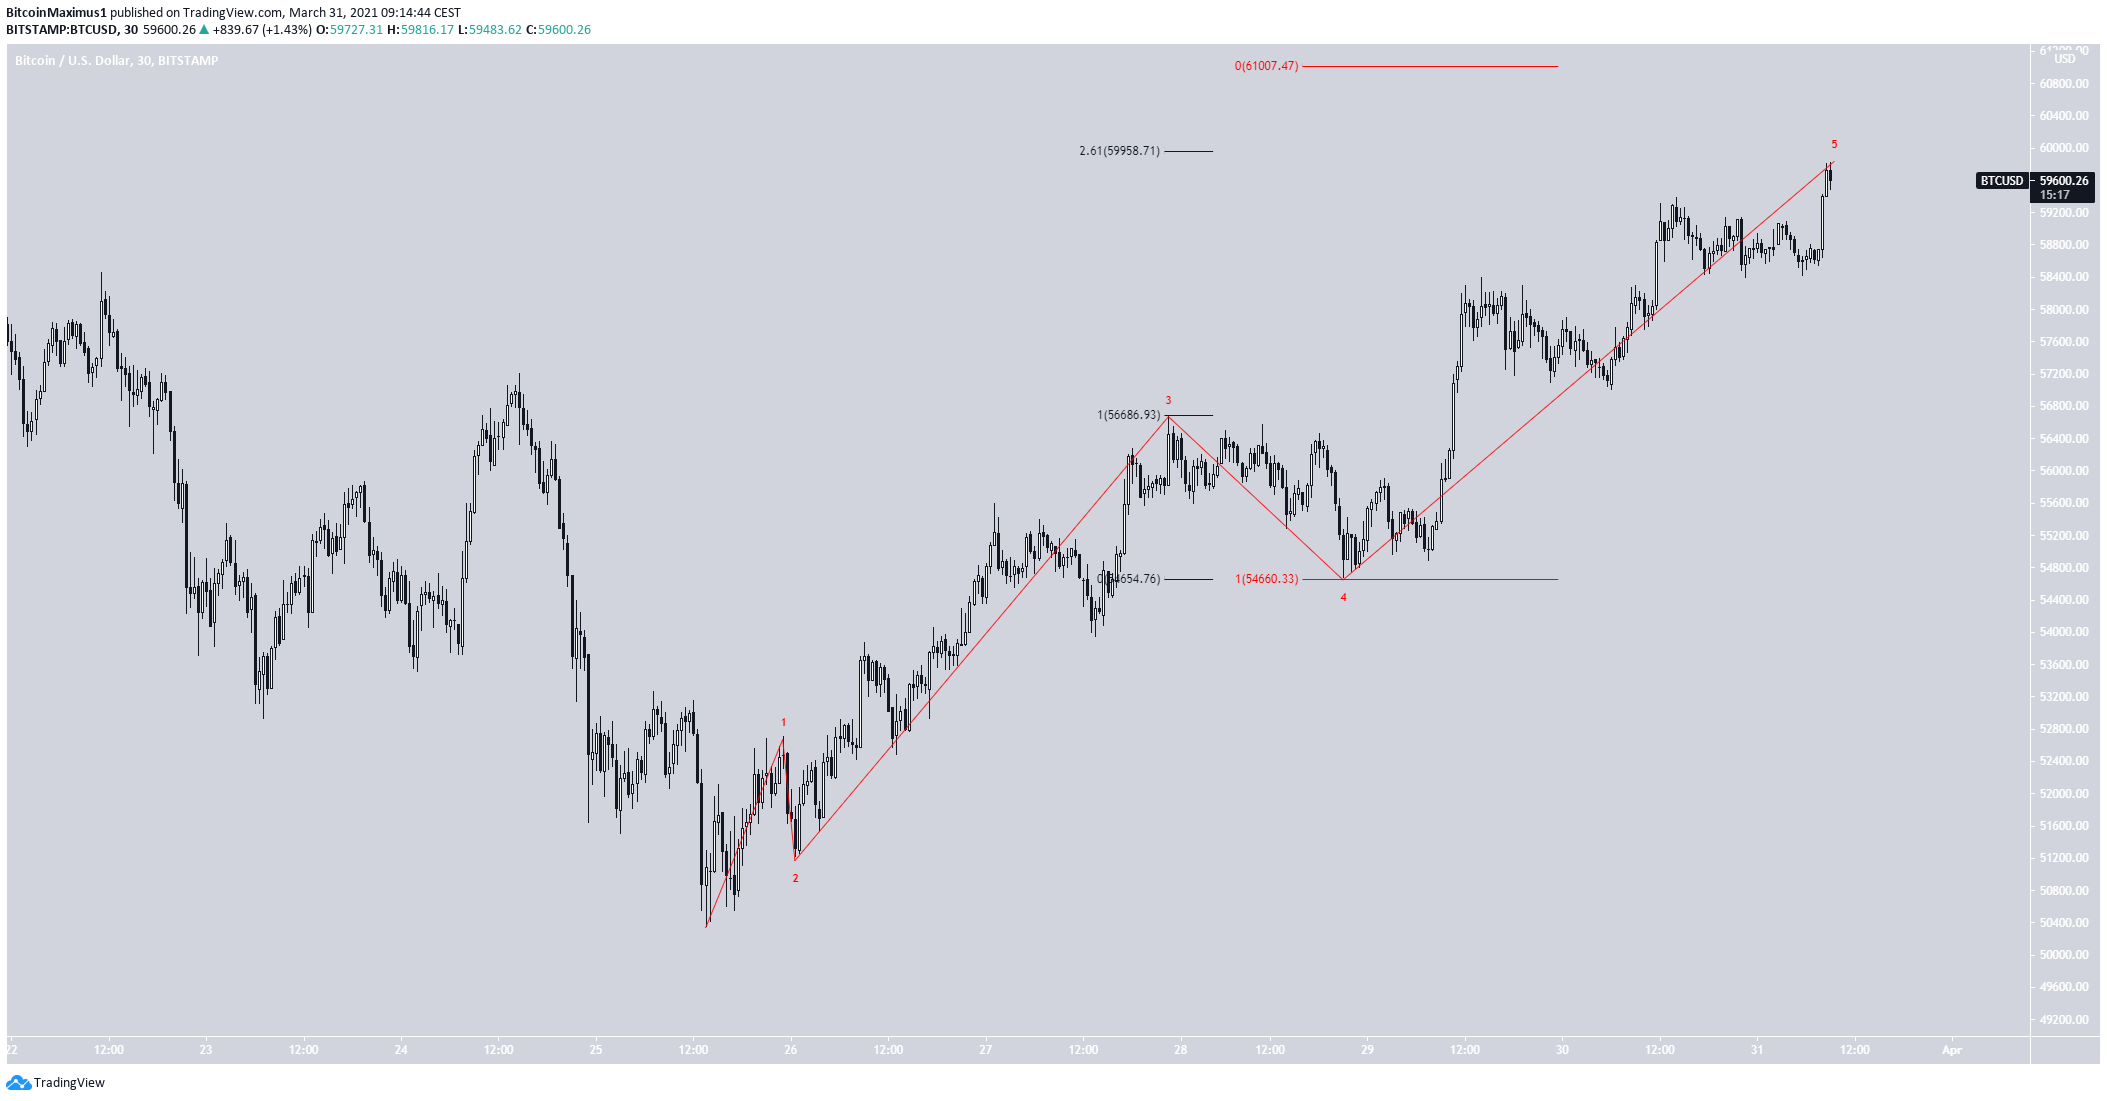
A short-term wave count (highly speculative) suggests that BTC is nearing the top of a bullish impulse.
While this is likely still a longer-term minor sub-wave one, BTC would be expected to correct soon.
A potential target for the top of this move is found between $60,000-$61,000.
Conclusion
BTC is expected to soon reach a new all-time high price. However, a short-term retracement could be likely prior to the final upward move.
For BeInCrypto’s previous BTC (BTC) analysis, click here.
The post BTC (BTC) Approaches $60,000 — Will It Break Out? appeared first on BeInCrypto.


