Table of Contents
BTC (BTC) appears to be trading inside a descending parallel channel.
On May 17, it bounced at the support line of this channel and has been increasing since.
BTC bounces at support
BTC has been moving downwards at an accelerated pace since May 10. The decrease has taken the price all the way down to a local low of $42,000 on May 17.
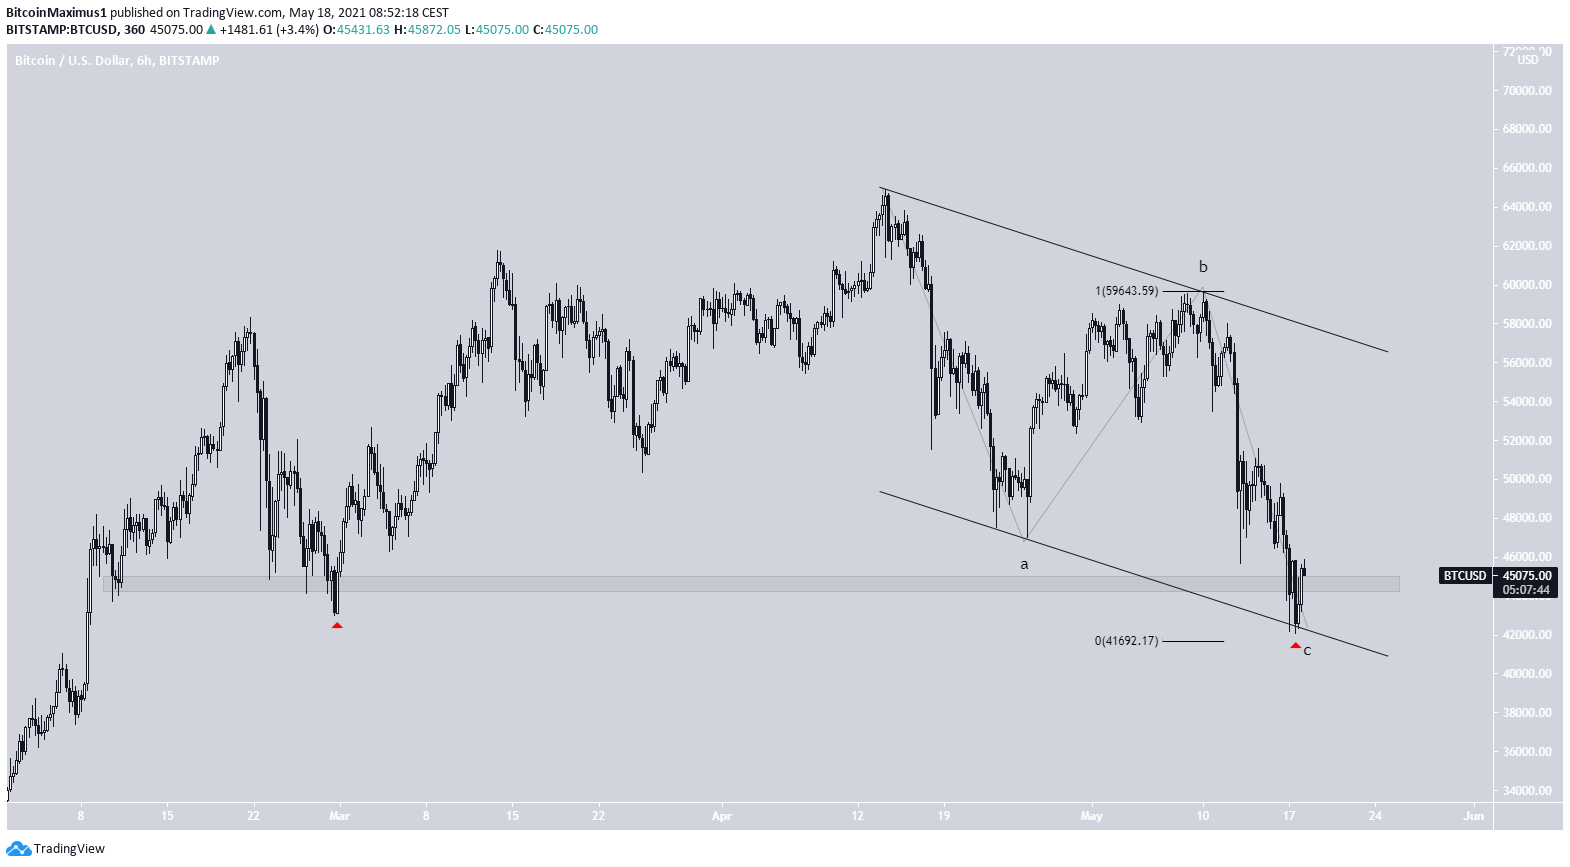
The low was made right at the support line of a descending channel that has been in place since the April 14 all-time high. Parallel channels are often corrective movements, so an eventual breakout is likely.
The MACD, RSI, and Stochastic oscillator are all decreasing. However, all three have generated bullish divergences, a strong sign that the price is likely to head higher.

Ongoing Bounce
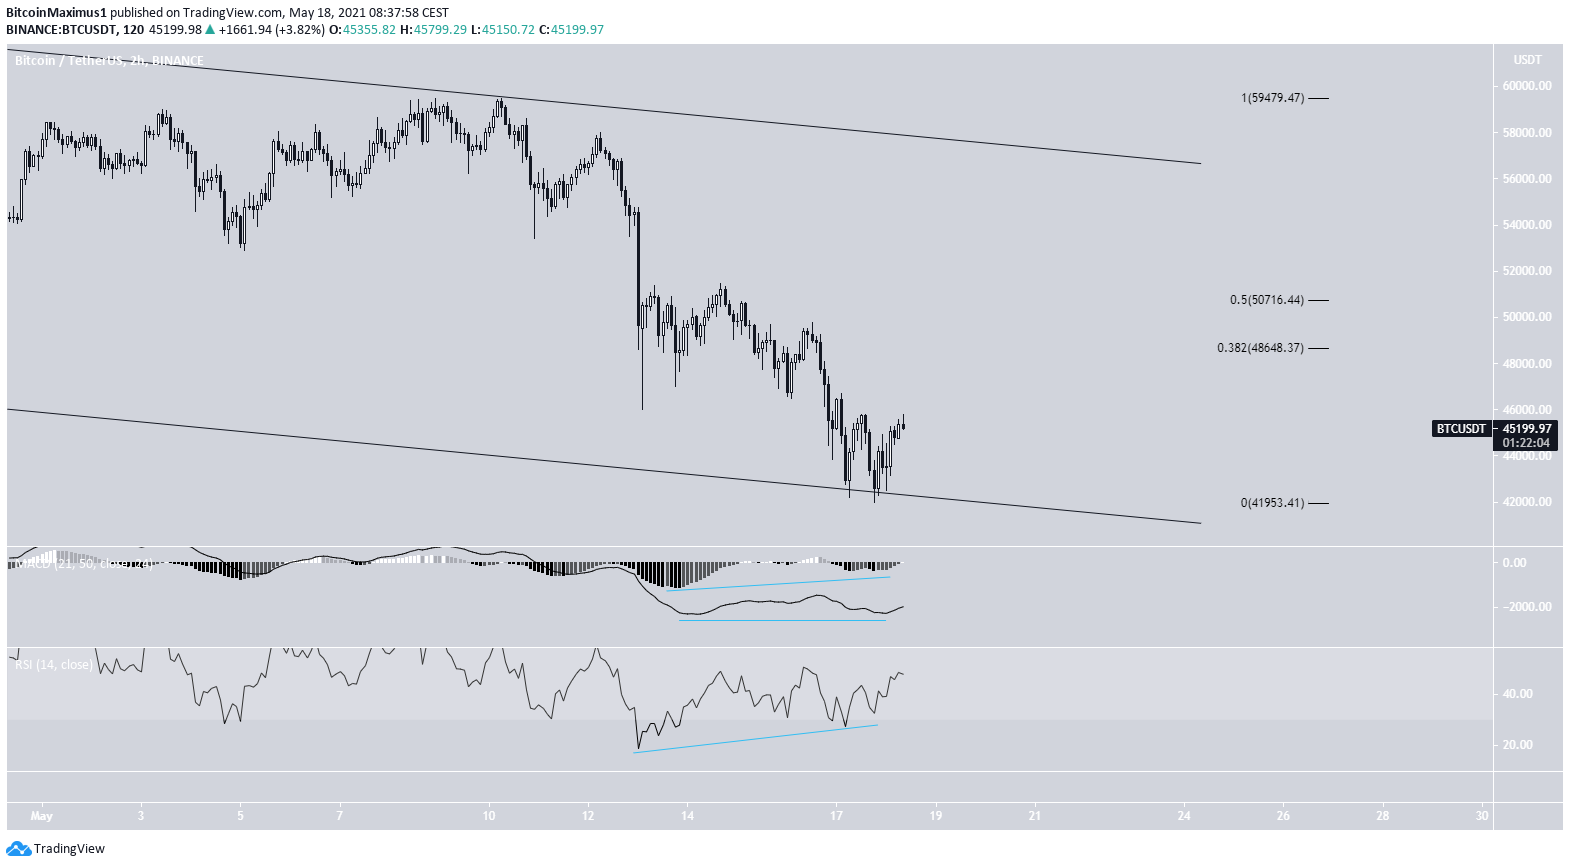
The two-hour chart is bullish. It shows a double bottom pattern at the support line of this channel, after which the price began to move upwards.
In addition, the bounce has been combined with a considerable bullish divergence in both the RSI and MACD.
Therefore, BTC is likely to continue moving upwards towards the main resistance area at $48,650-$50,700. This target area was found by using the 0.382-0.5 Fib retracement levels.

BTC Wave Count
The wave count shows a completed A-B-C corrective structure. In addition, the structure is perfectly contained inside the channel, increasing its validity.
Furthermore, waves A:C have nearly an exact 1:1 ratio, making it likely that a bottom has been reached.
Currently, the price is attempting to reclaim the $44,500 area after deviating below it and bouncing on the support line.
For the longer-term wave count, click here.

Conclusion
BTC is expected to resume moving toward the aforementioned resistance area between $48,650 and $50,700. It’s possible that the price has reached a local bottom.
For BeInCrypto’s previous BTC (BTC) analysis, click here.
The post BTC (BTC) Begins Strong Bounce at Channel Support appeared first on BeInCrypto.


