BTC (BTC) Breaks Out From Range With Strength
2 min readBTC (BTC) increased considerably during the week of Aug 2-8, reaching a high of $45,310.
It’s approaching a strong confluence of resistance levels between $46,950 and $47,750. In addition to this, short-term time frames are showing weakness.
BTC weekly outlook
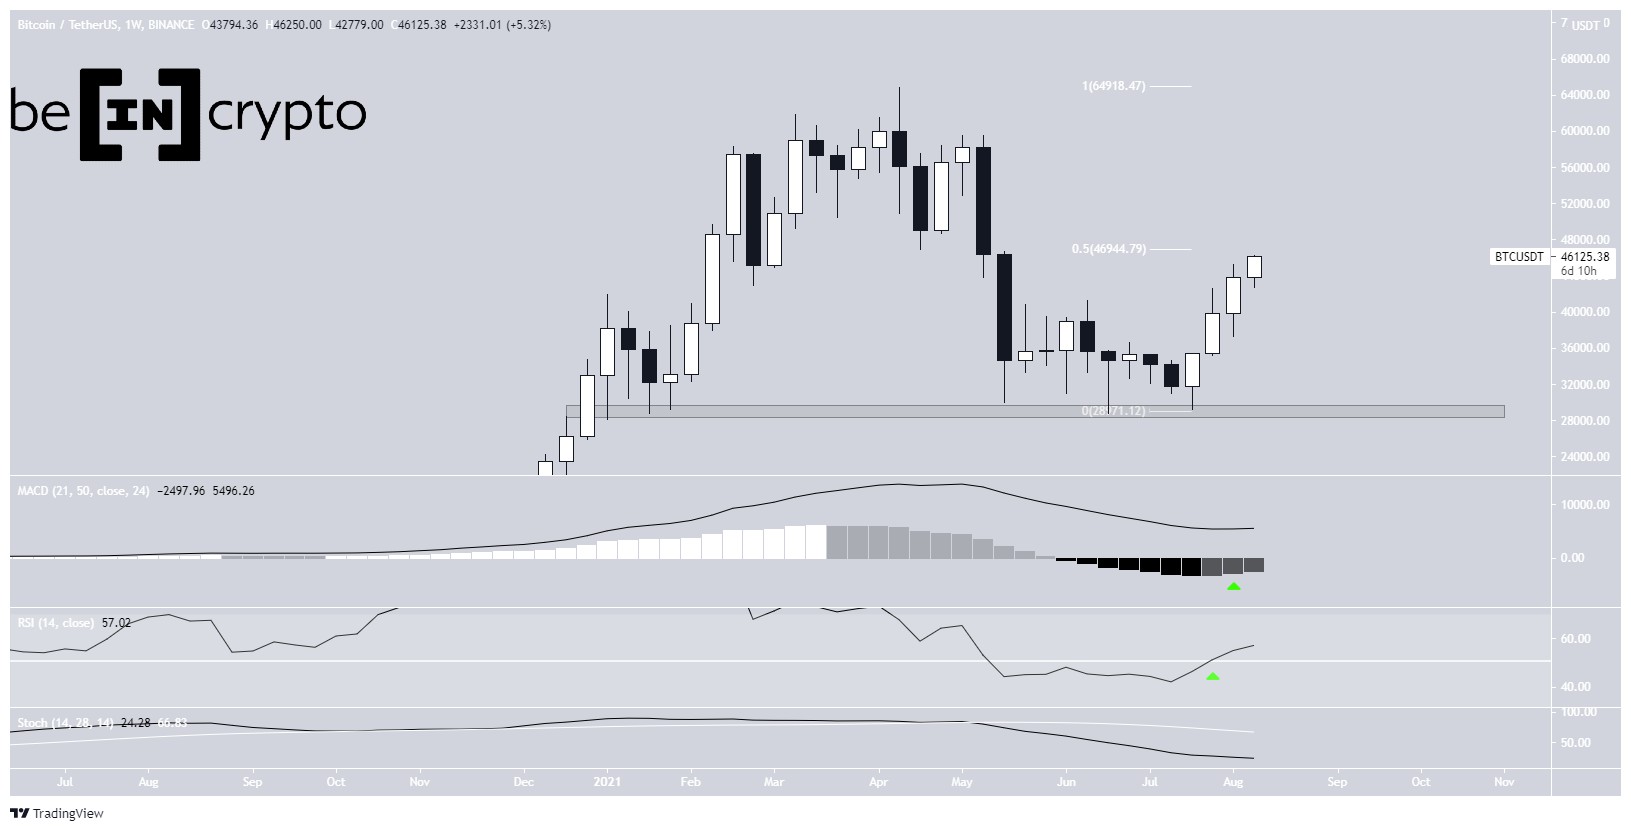
BTC has created three consecutive bullish candlesticks in the weekly time frame and is in the process of creating a fourth.
The upward move began after the price bounced at the $29,000 horizontal support area on July 21.
Currently, BTC is trading under the 0.5 Fib retracement resistance level at $46,950.
Technical indicators are showing some bullish signs, but not enough to confirm a bullish reversal. While the MACD has given a bullish reversal signal and the RSI has just crossed above 50, the Stochastic oscillator is still bearish.

BTC approaches resistance
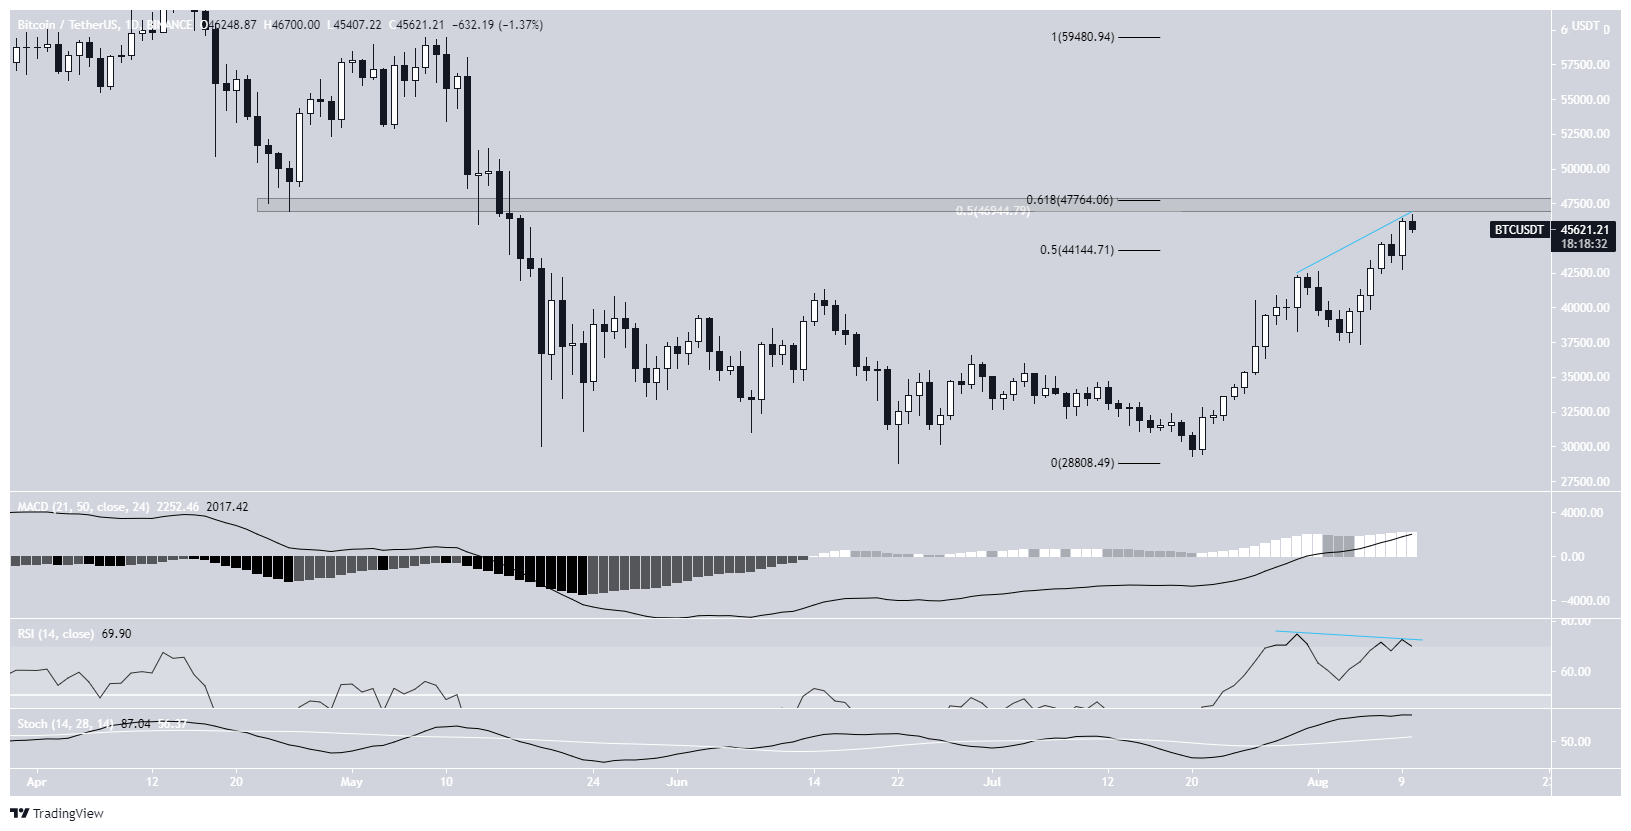
The daily chart shows that BTC is approaching a strong resistance level between $46,950 and $47,750. The resistance is created by the short-term 0.618 Fib retracement résistance level (black), the previously outlined long-term 0.5 Fib retracement level (white), and a horizontal resistance area.
While technical indicators are still bullish, there is a potential bearish divergence developing in the RSI.

Future movement
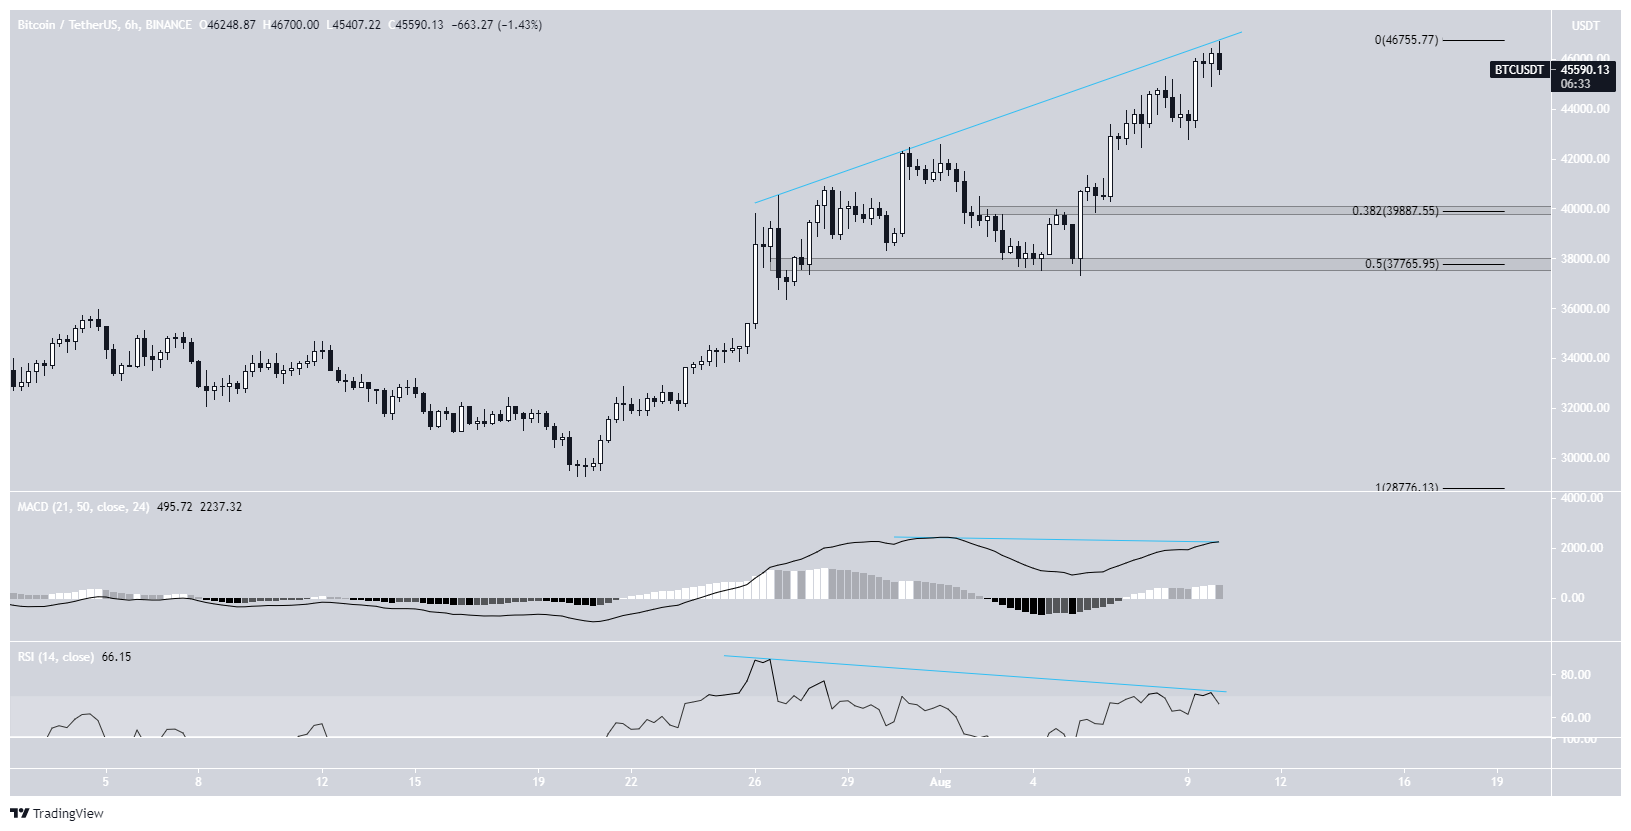
Similarly, there are more signs of weakness in even lower time frames such as the six-hour chart. Both the RSI and MACD have generated bearish divergences. In addition to this, it seem that BTC is following an ascending resistance line, which has just rejected the price.
If a downward move occurs, the closest support levels would be found at $39,900 and $37,750.

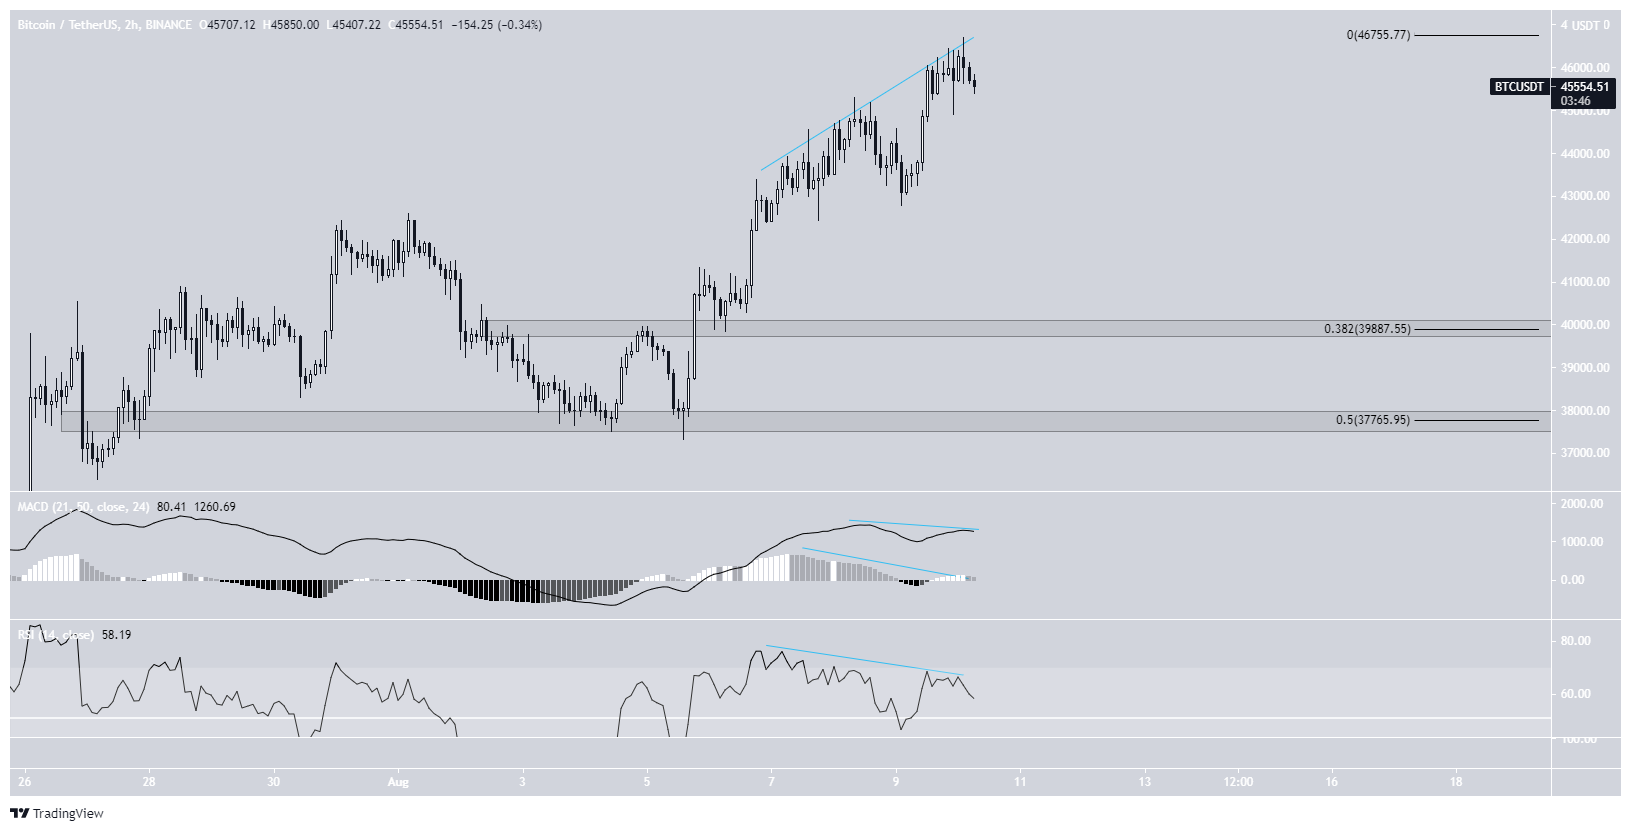
In addition to this, the two-hour chart provides a very similar reading. Both the MACD and RSI have generated considerable bearish divergences.
These readings support the possibility that a short-term downward move could soon transpire.

For BeInCrypto’s previous BTC (BTC) analysis, click here.
The post BTC (BTC) Breaks Out From Range With Strength appeared first on BeInCrypto.


