BTC (BTC) Makes Another Attempt At Breaking Out Above $46,800
2 min readBTC (BTC) managed to reach a high of $46,743 on Aug 11, but was rejected almost immediately after.
The ongoing decrease was preceded by significant short-term weakness. Following this, BTC broke down from an ascending wedge.
BTC gets rejected
BTC has been moving upwards at an accelerated rate since creating a higher low on Aug 5. This led to a high of $46,743 on Aug 11.
The high was made at the lower portion of the range between $46,800-$47,800. This range is created by a confluence of Fib retracement levels and is also a horizontal resistance area. After this, BTC created a shooting star candlestick (red icon) and decreased sharply toward $45,000.
The decrease was preceded by bearish divergence in the RSI and the MACD has created one lower momentum bar, a sign that momentum is gradually reversing.
Therefore, it’s possible that the top of the move has been reached.

Ongoing decrease
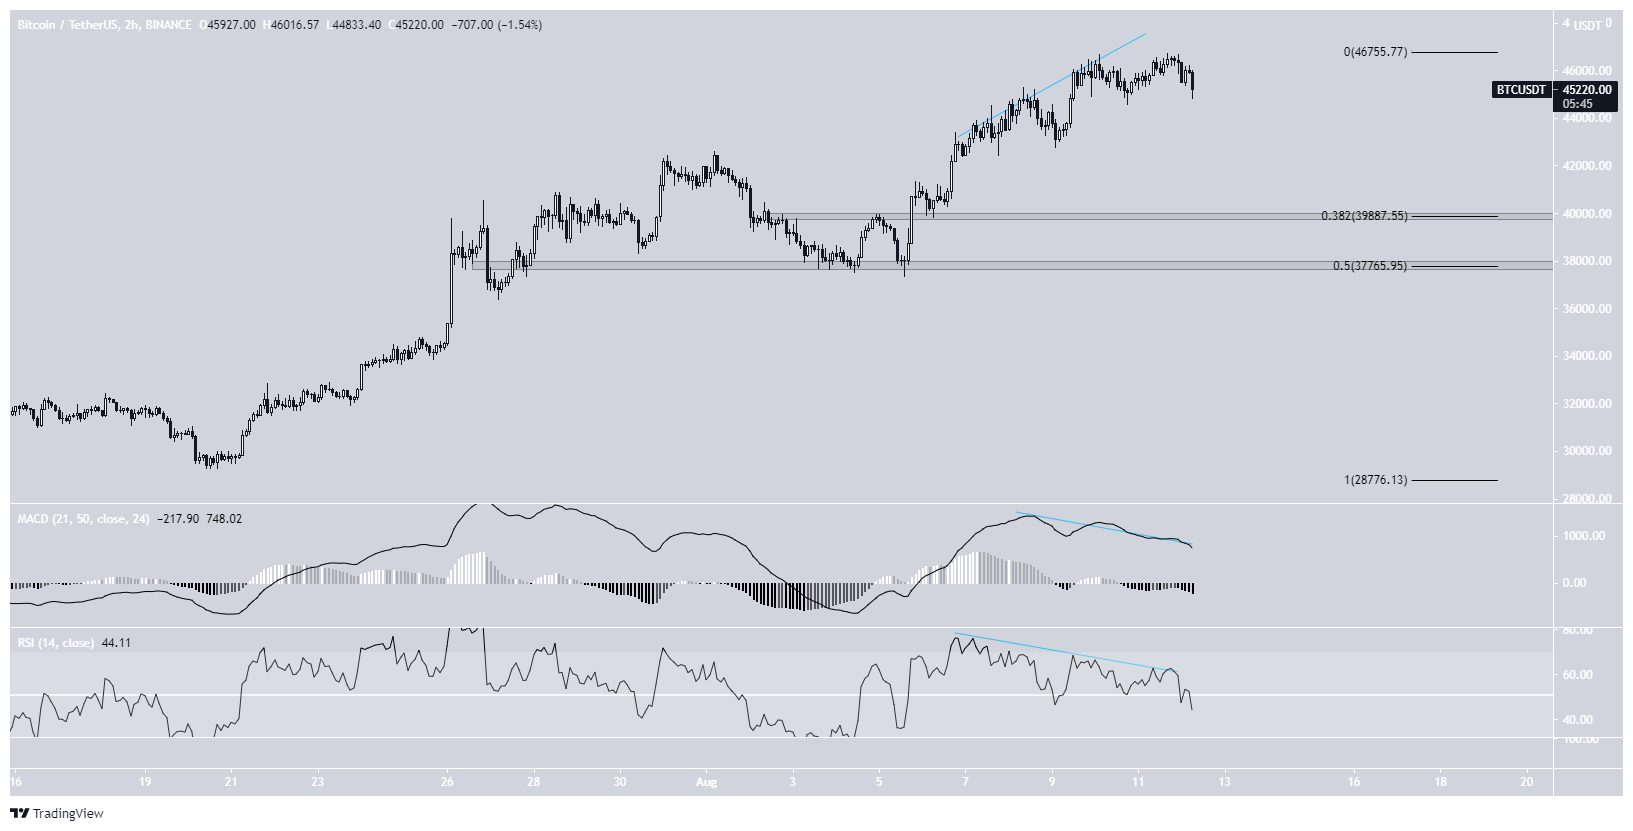
The two-hour chart shows that the downward move was preceded by significant bearish divergences in the RSI and MACD.
If a downward move transpires, the main support areas are found at $39,900 and $37,770. These levels are the respective 0.382 and 0.5 Fib retracement support levels.

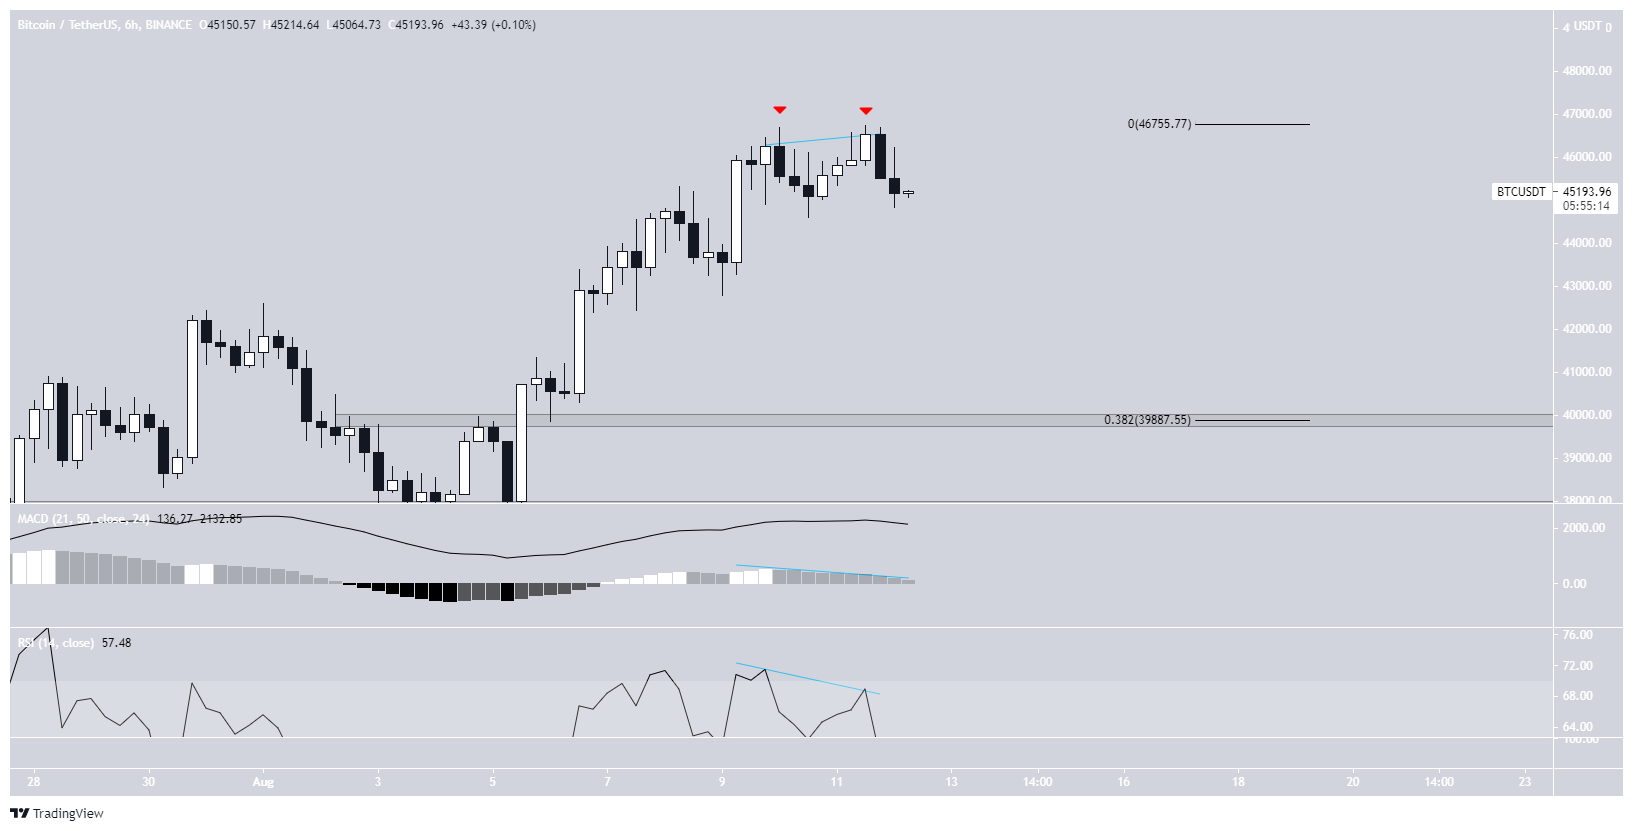
The same outlook is shown in the six-hour time frame. It also shows a double top pattern, in which the second top was followed by a bearish engulfing candlestick.

Wave count
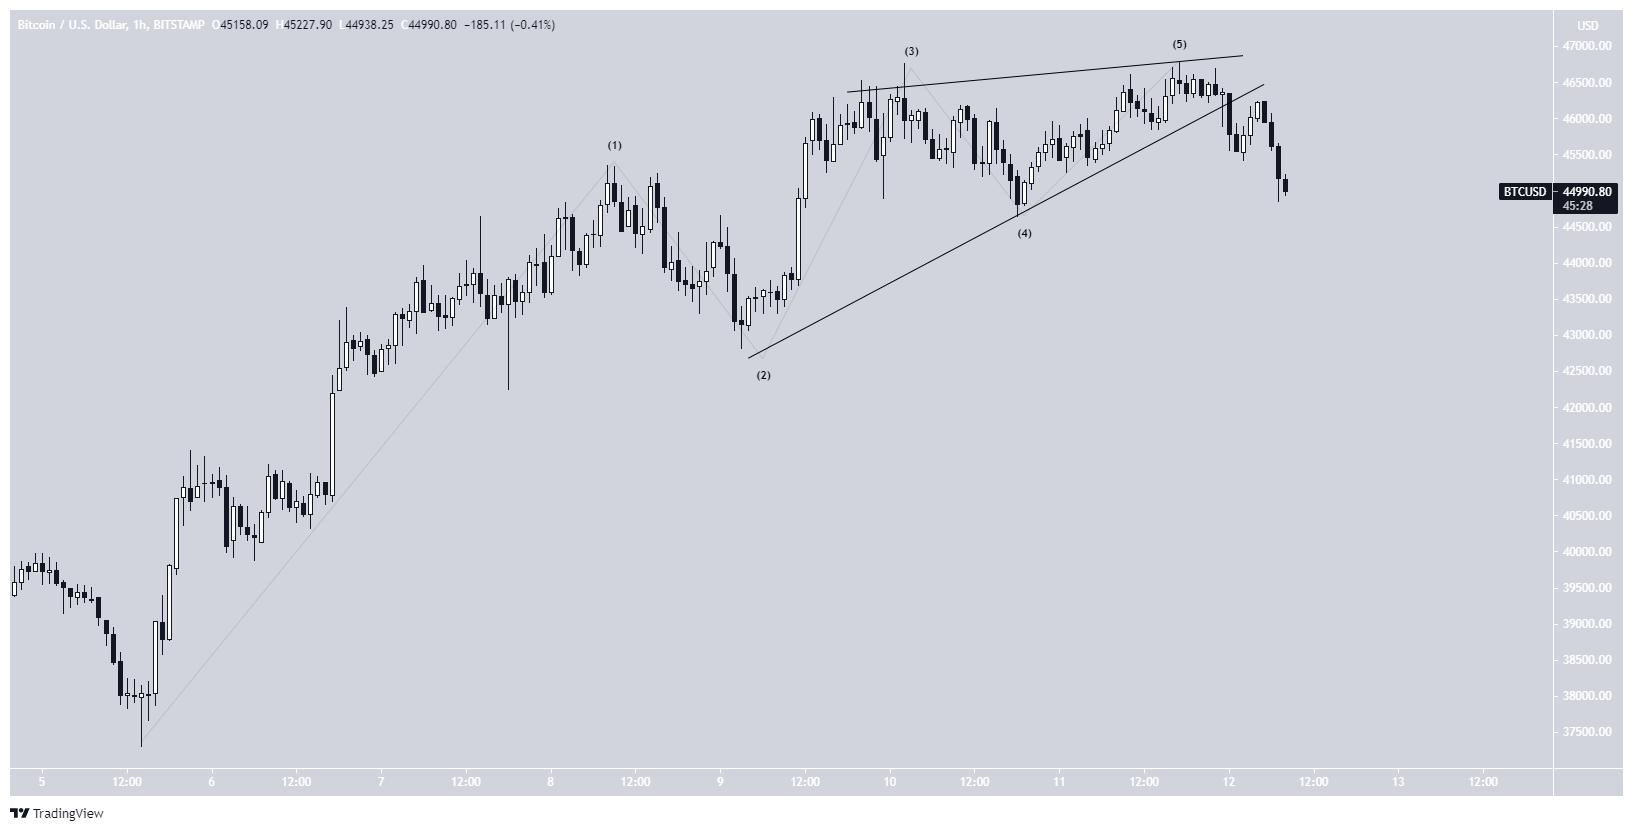
The long-term wave count is not entirely clear. However, the higher high from Aug 11 indicates that it’s possible that wave five has been completed.
In this case, it was as part of an ending diagonal, completing with the $46,743 high. After this, BTC broke down from an ascending wedge and may have begun to correct.
If this is true, BTC could decrease toward the support levels outlined above.

For BeInCrypto’s previous BTC (BTC) analysis, click here.
The post BTC (BTC) Makes Another Attempt At Breaking Out Above $46,800 appeared first on BeInCrypto.


