BTC (BTC) Searches for Support After Breakdown
2 min readBTC (BTC) has been moving downwards since reaching a local high of $42,599 on Aug 2 and has broken down from an ascending support line.
However, it has reached support and technical indicators suggest a short-term rebound in price.
BTC continues descent
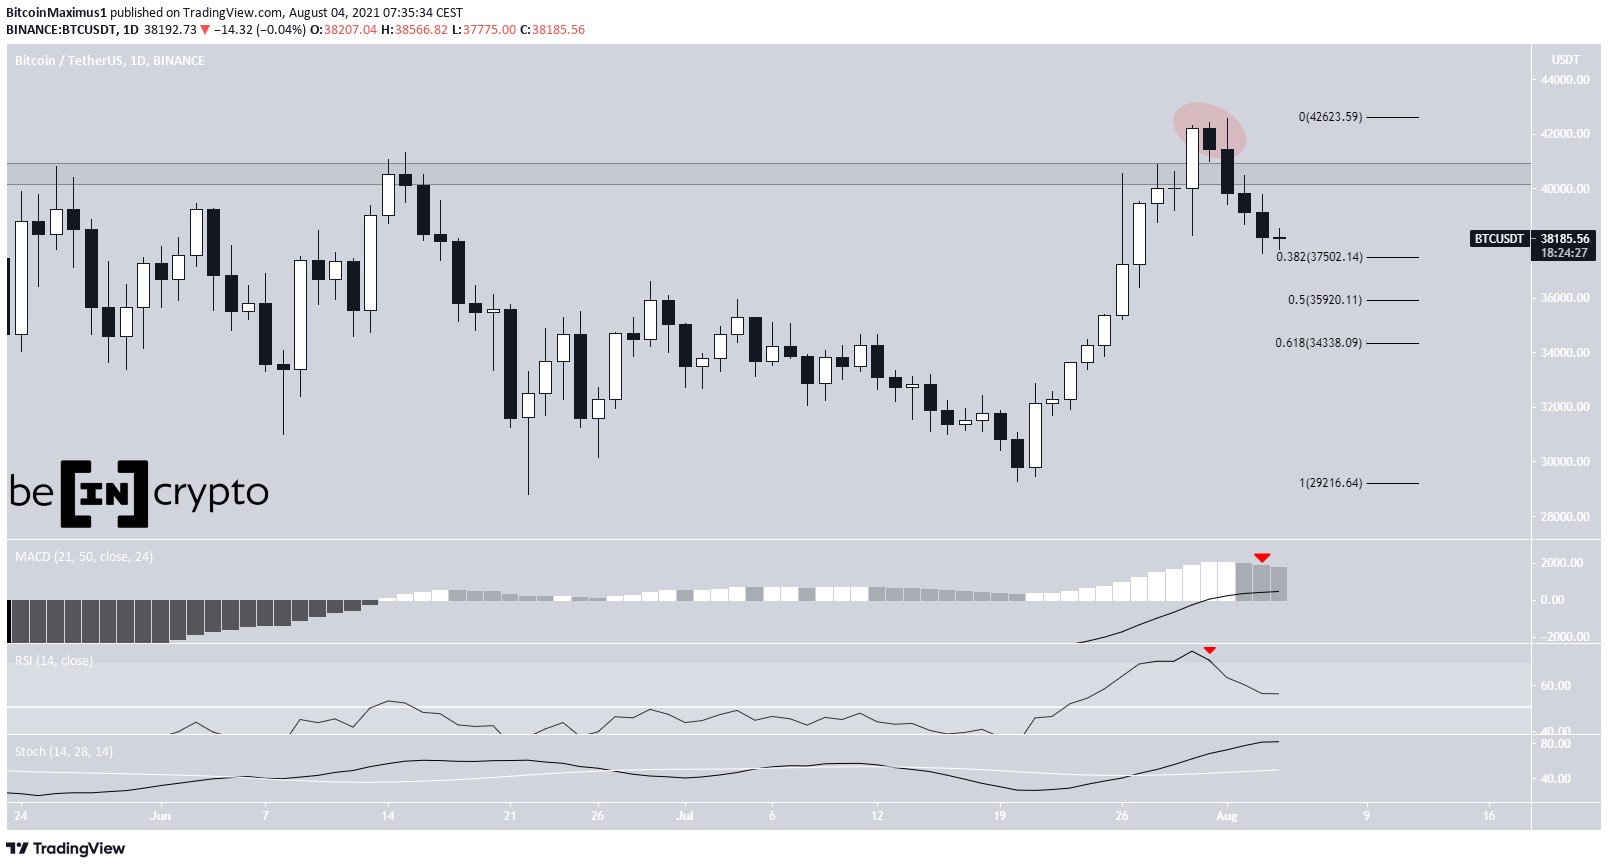
BTC has been moving downwards since deviating above the $40,550 range high between July 30 and Aug 2 (red circle), reaching a high of $42,559.
Currently, it’s trading just above the 0.382 Fib retracement support level at $37,500. The next supports are found at $35,900 and $34,340 — the 0.5 and 0.618 Fib retracement support levels.
Technical indicators are beginning to show bearish signs. The MACD has given a bearish reversal signal and the RSI has fallen below 70. However, the Stochastic oscillator is still bullish.

Ongoing breakdown
The six-hour chart shows that BTC has broken down from an ascending support line.
This coincided with a RSI move below 50 (red icon). Interestingly, the RSI had moved above 50 (green icon) as soon as the ascending support line was created.
Despite this, the price is just above the 0.382 Fib retracement level, a likely place for a bounce.

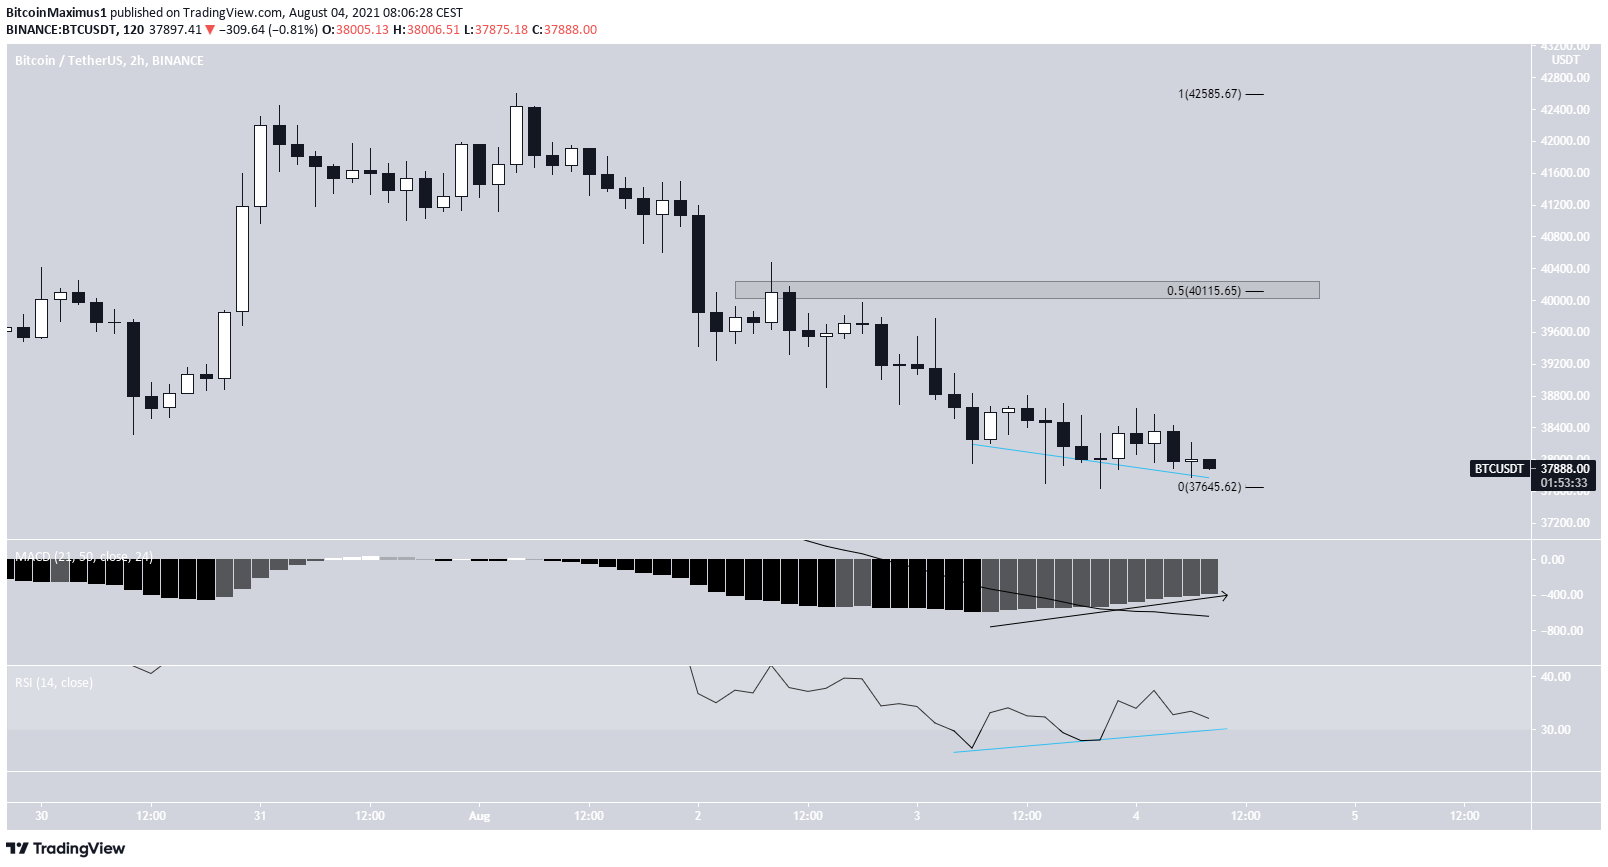
The two-hour chart for BTC supports the possibility of a bounce. It seems that the downward movement is slowing and gradually turning bullish, as visible by the MACD.
In addition to this, the RSI has generated some bullish divergence.
If an upward move occurs, the closest resistance area would be found at $40,115. This target is the 0.5 Fib retracement resistance level and a horizontal resistance area.

Wave count
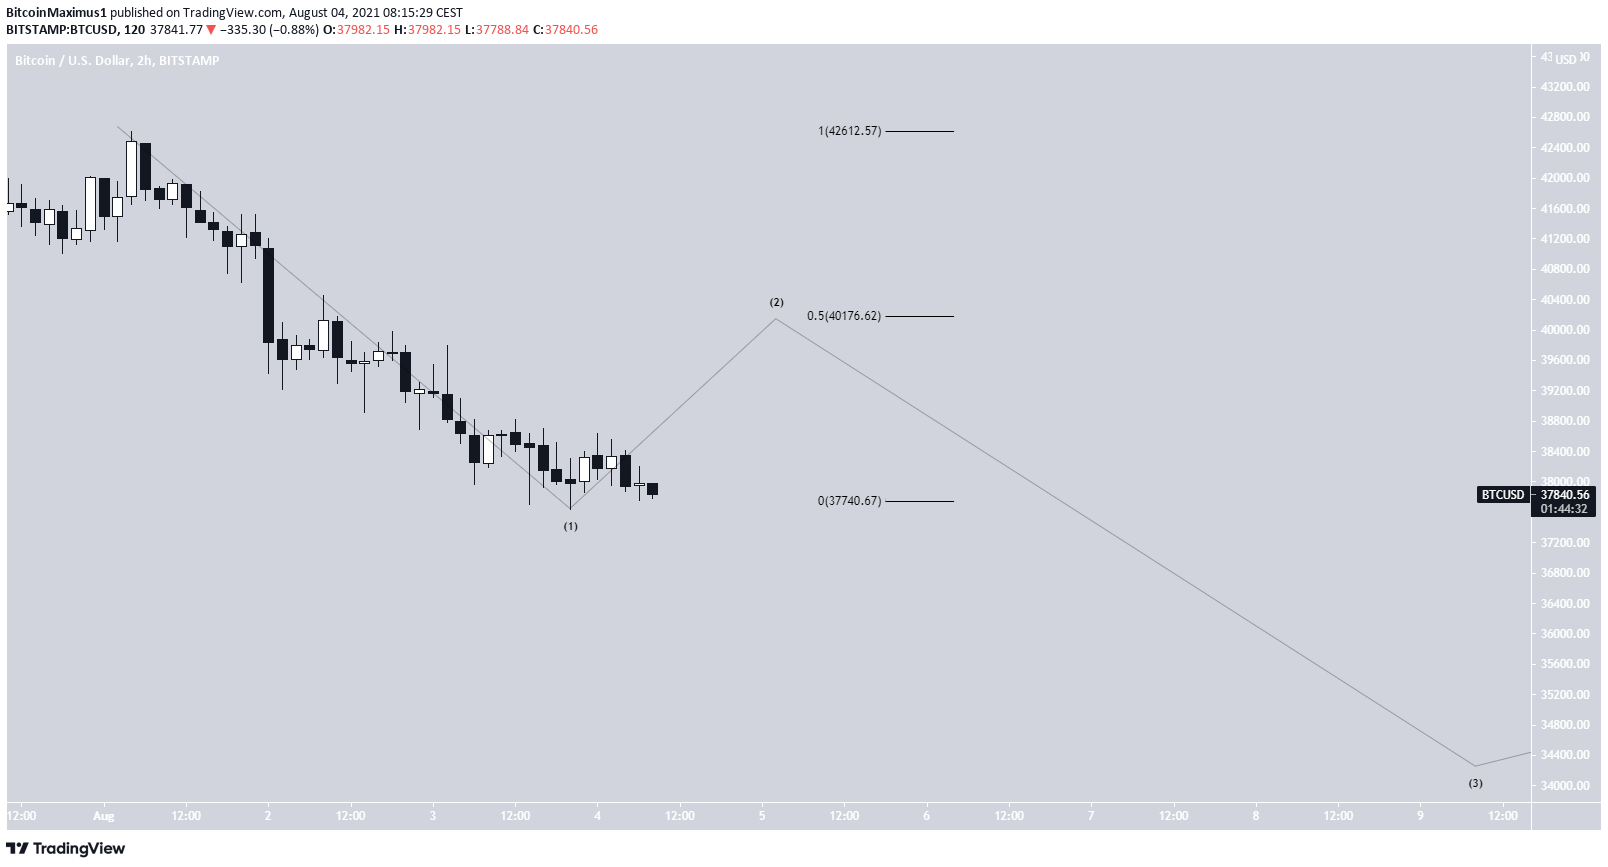
The short-term count indicates that BTC is at or nearing the end of sub-wave one (black) of a bearish impulse. If correct, it could soon initiate a bounce to complete sub-wave two, as outlined in the previous section.
For the longer-term count, click here.

For BeInCrypto’s previous BTC (BTC) analysis, click here.
The post BTC (BTC) Searches for Support After Breakdown appeared first on BeInCrypto.


