BTC drops 2.65% and closes ninth consecutive week of devaluation
2 min read
O BTC registered a devaluation of 2.65% between the 22nd and 29th of May, according to data from the Coinglass platform. As a result, the string of cryptocurrency devaluations reached nine weeks, the longest in cryptocurrency history.
This sequence began at the end of March, with a modest 0.9% devaluation. Since then, however, BTC has accumulated a devaluation of 46.94%. The price closed the week at $29,340, well below the $48,000 recorded at the start of the streak.
BTC closes ninth week of losses. Source: Coinglass.
However, the price reacted well this Monday (30) and reached a high of more than 6%, taking the price of BTC again above $ 30,000.
Has the bottom arrived?
Despite the recovery, the price of BTC has reached much lower values, in the region of $28,700. This value is the 0.618 Fibonacci retracement support level. This is considered a crucial support level as there is no further support until below $20,000.
At the same time, the weekly Relative Strength Index (RSI) is also in a boundary zone. Currently at 34, the RSI is at exactly the same value as the March 2020 crash. In fact, the only other time the RSI has been this low was in December 2018 when the price dropped to $3,300.
In short, both the chart and strength indicators are on the bullish side. The Fibonacci above support and the RSI at the lows indicate that the bottom is near. Therefore, the trend is for the market to recover and register valuations again, breaking this sequence.
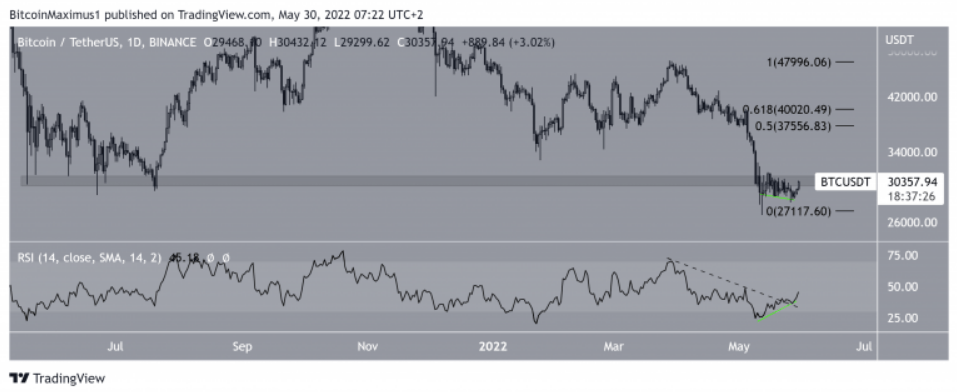
On the other hand, the devaluation of the last few weeks has turned old supports into strong resistances. In this case, the $30,500 region has set itself up as one of those resistances that BTC will need to overcome.
Between optimism and pessimism
Despite this occurrence, the daily RSI is decisively bullish. First, it generated a sizable bullish divergence (green line), a signal that often precedes uptrend reversals. Furthermore, the indicator broke out of a falling (black) trend line.
BTC RSI Analysis. Source: TradingView.
If this event starts a bullish move in price above $30,500, the next closest resistance area would be between $37,500 and $40,000. This target range is the 0.5 and 0.618 Fib retracement resistance area.
Thus, the daily chart is a little more bullish than the weekly. Despite the fact that the price is trading below horizontal resistance, the RSI is decisively bullish. However, analyst Bernardo Pasco witch is skeptical of this recovery.
“After 9 consecutive weeks of declines, one or a few weeks of highs do not mean reversing the declines. We are even more likely to go below USD 20,000 in 2022 or 2023,” he said.


