BTC, ETH, XRP, DASH, ENJ, RUNE, QNT — Technical Analysis July 29
3 min readTable of Contents
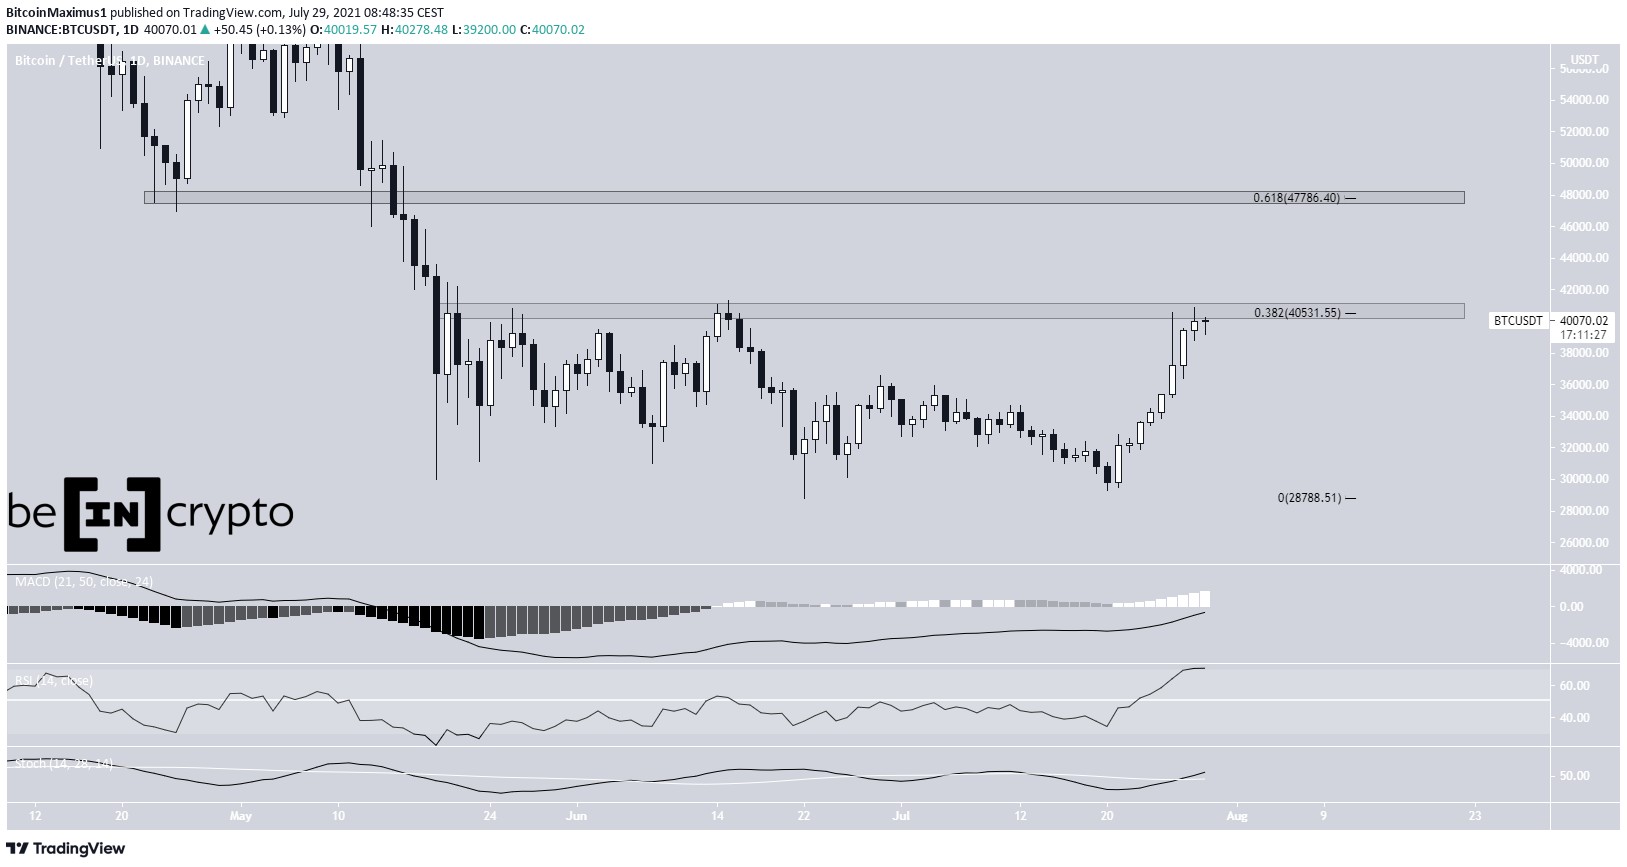
BTC (BTC) is making an attempt at moving above the $40,500 resistance area.
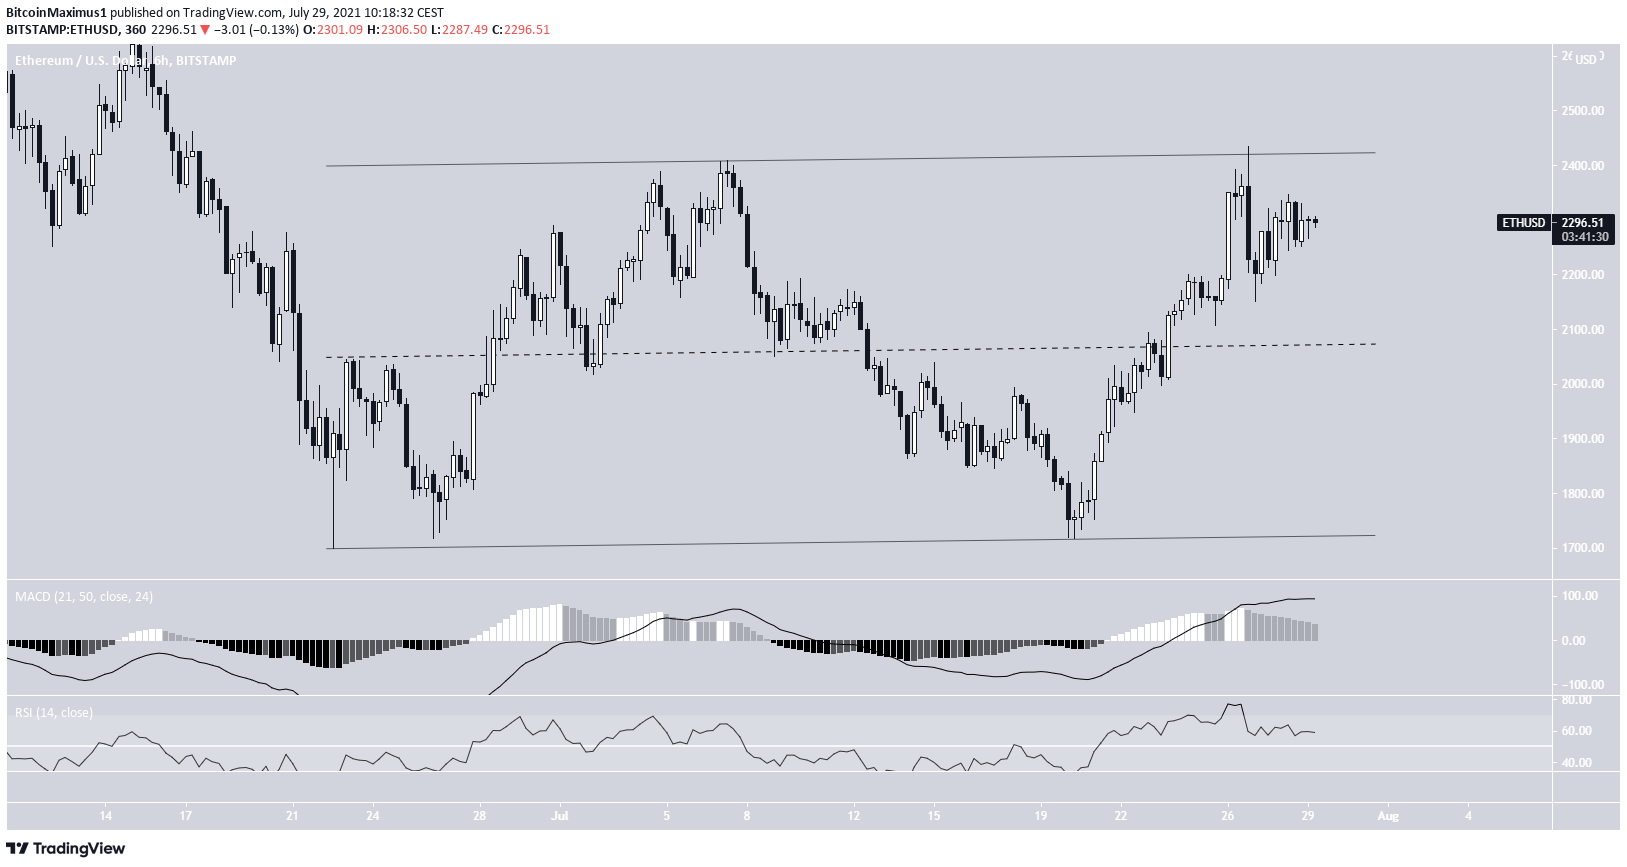
ETH (ETH) is trading inside an ascending parallel channel.
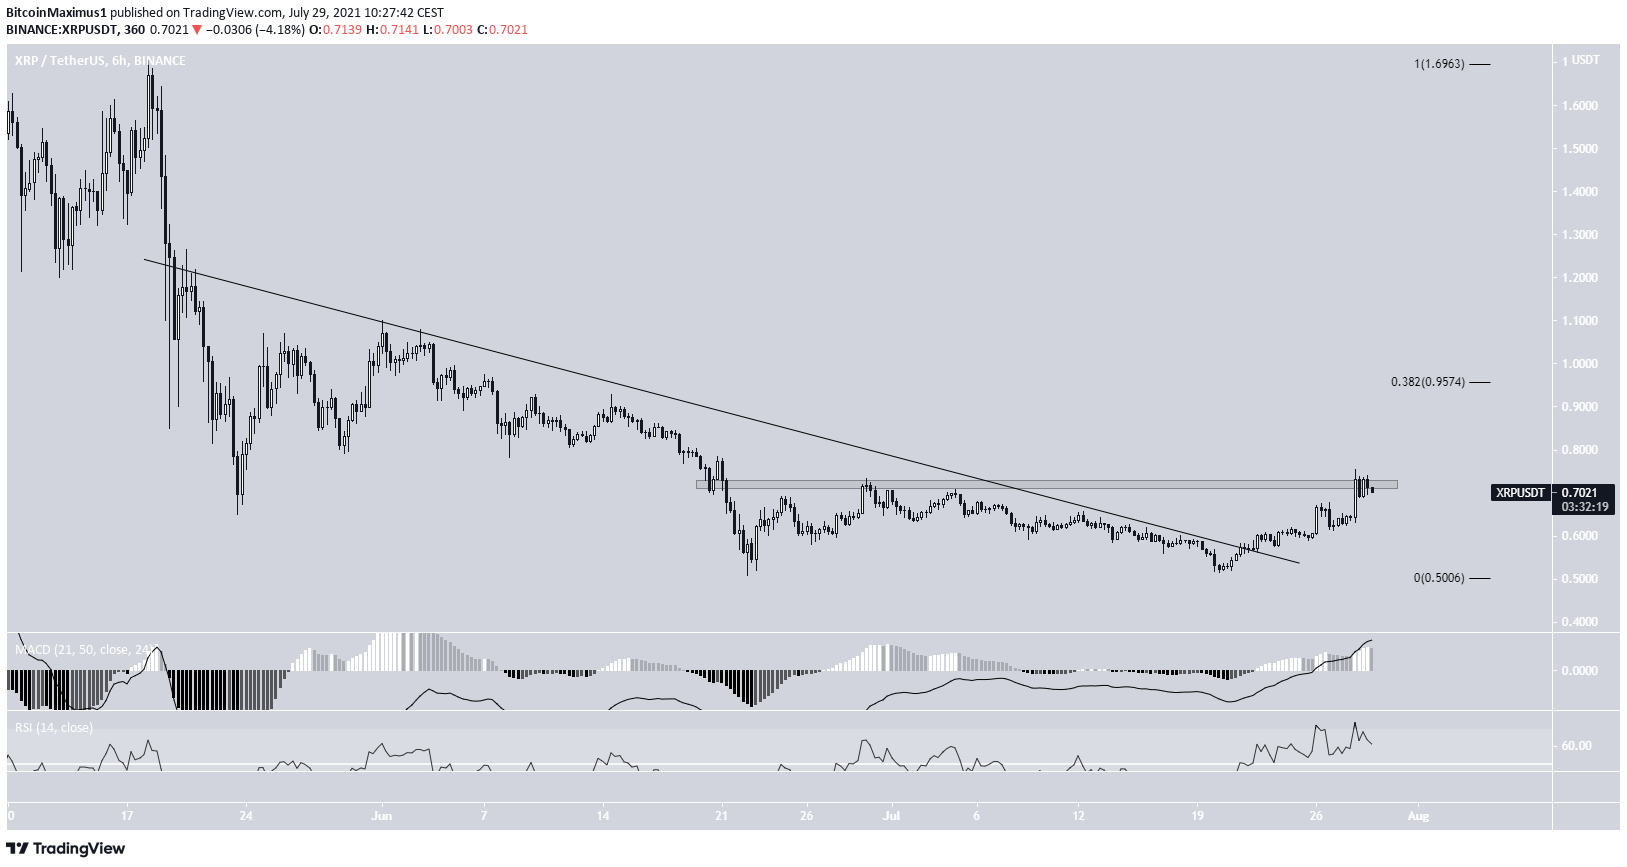
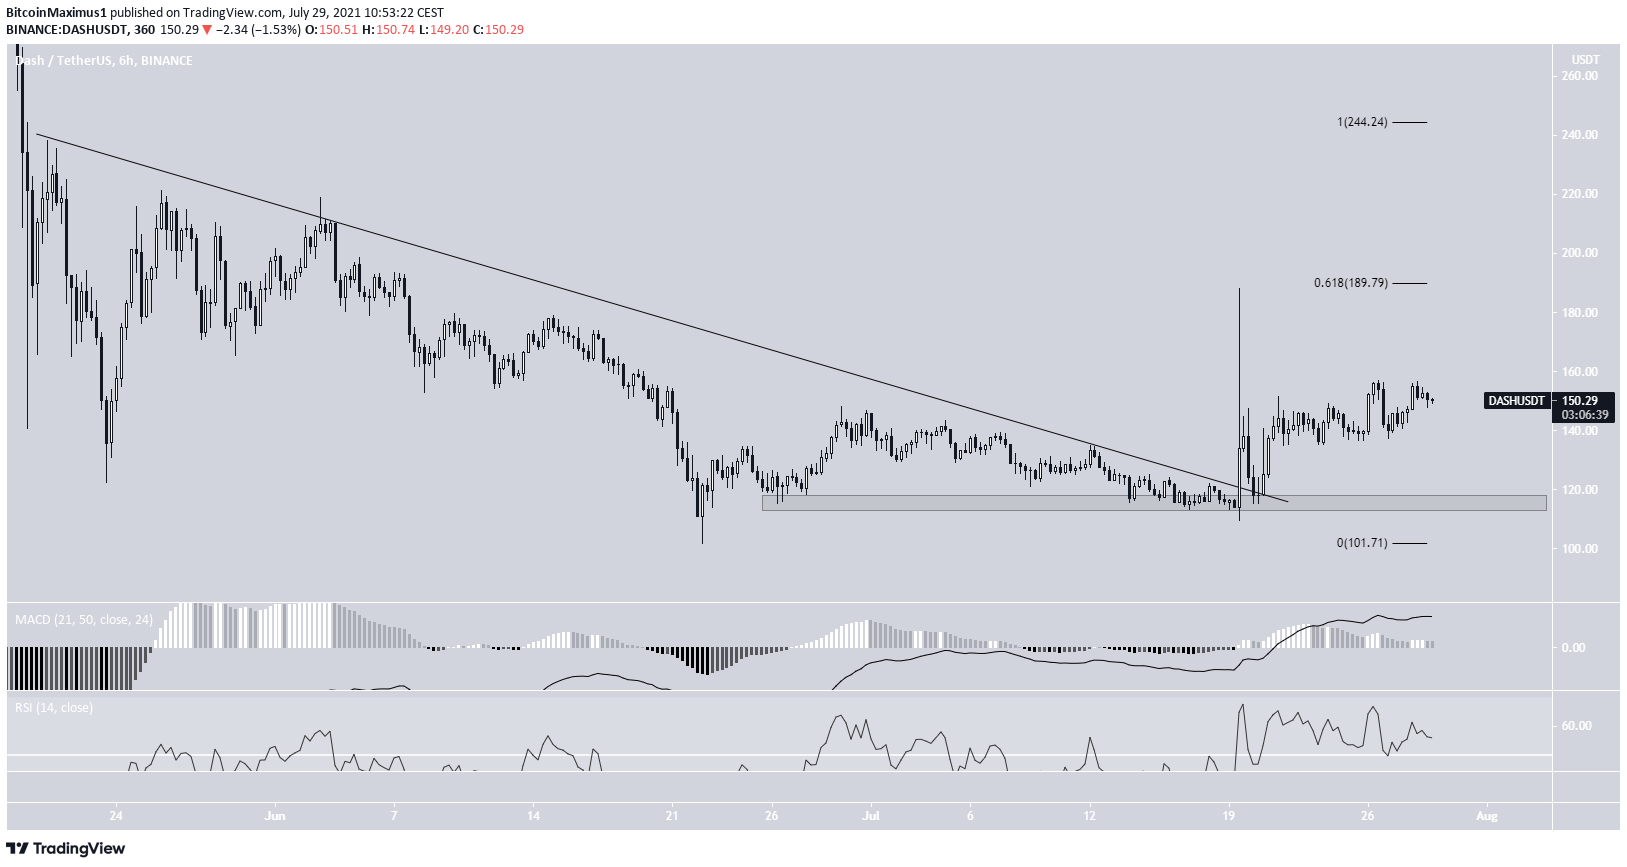
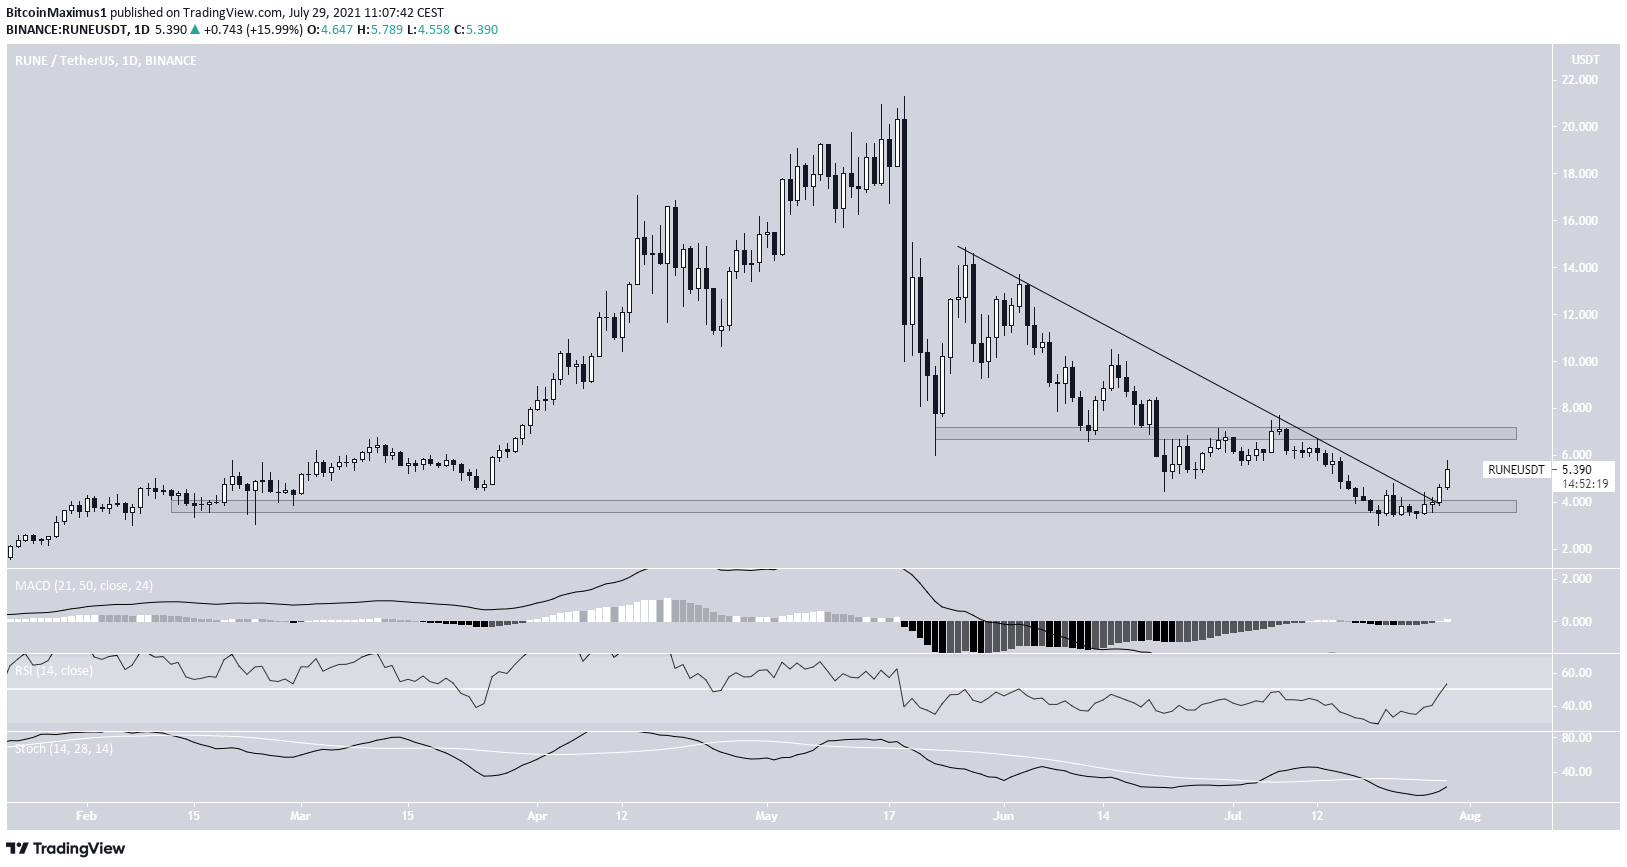
XRP (XRP), Dash (DASH), and THORChain (RUNE) have broken out from descending resistance lines.
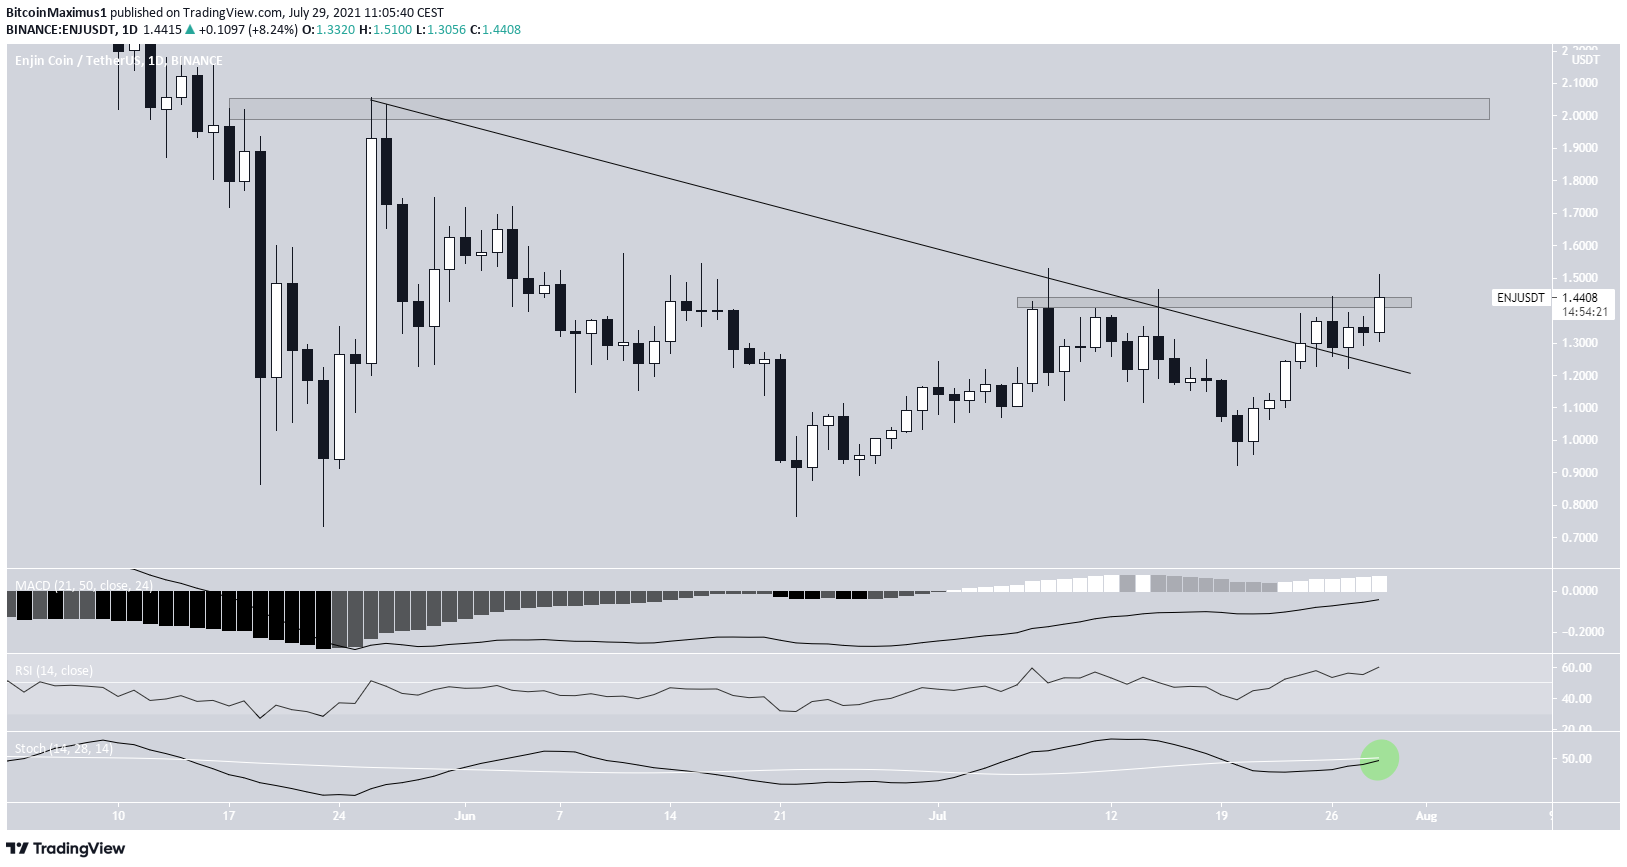
Enjin Coin (ENJ) has broken out from a descending resistance line and is attempting to reclaim the $1.43 horizontal resistance area.
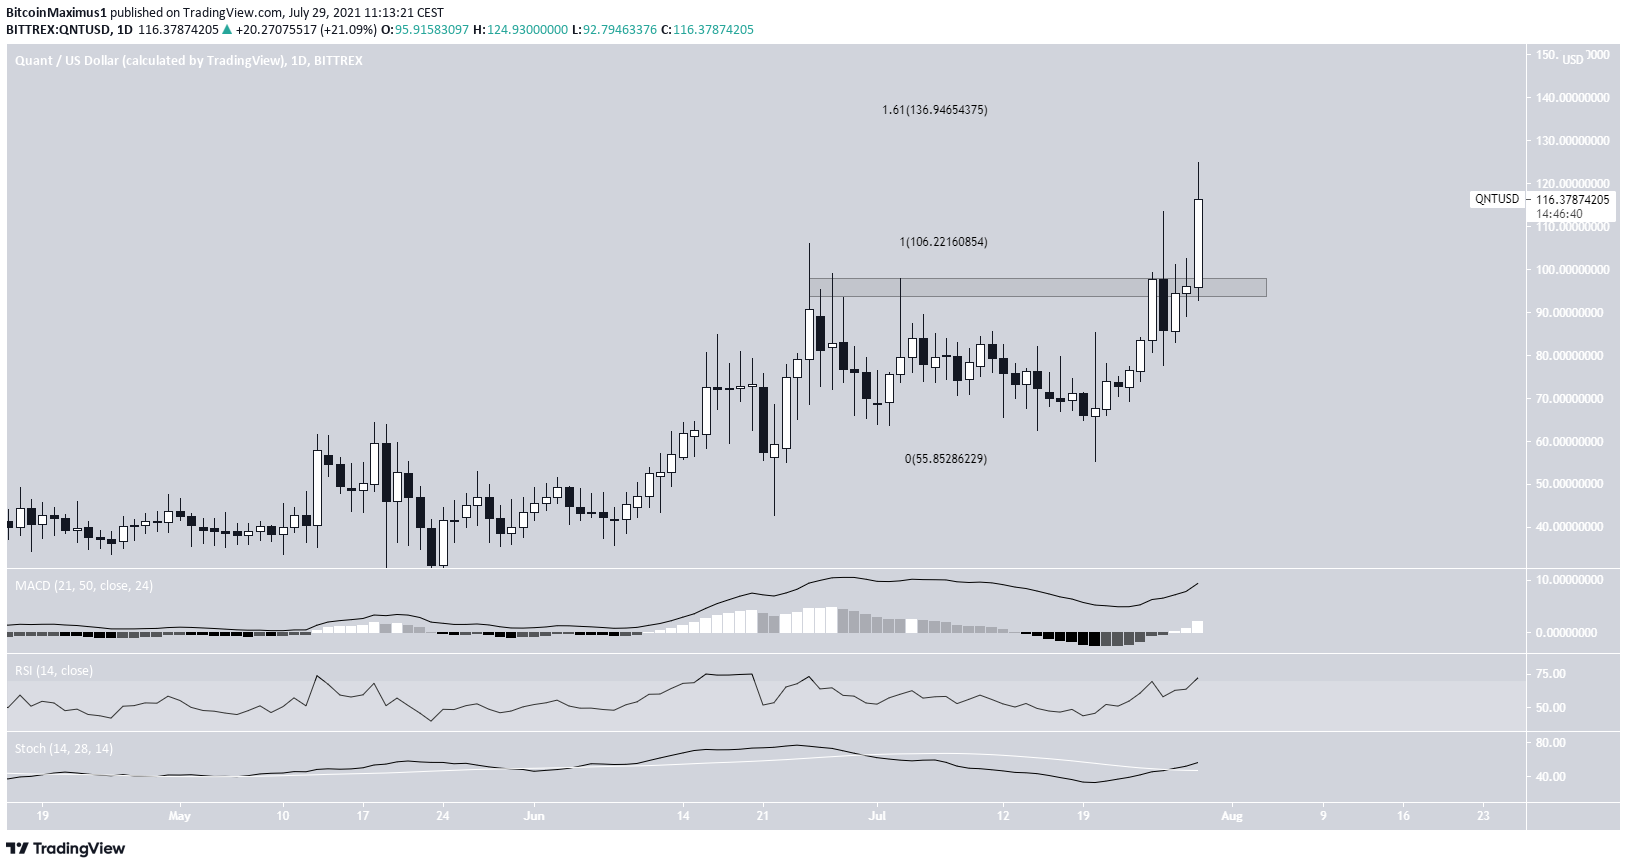
Quant (QNT) reached a new all-time high on July 28.
BTC
BTC has been increasing since reaching a low of $29,278 on July 20. It has managed to reach a high of $40,900 on July 28. This marked the seventh bullish candlestick in a row.
The high was made inside the $40,500 resistance area, which is also the 0.382 Fib retracement resistance level.
Technical indicators in the daily time frame are bullish. The RSI has moved above 70 and the Stochastic oscillator has made a bullish cross. In addition to this, the MACD is increasing and is almost positive.
Despite this, there is some short-term weakness developing.
ETH
ETH has been increasing inside an ascending parallel channel since June 22. Such patterns often contain corrective movements.
ETH was rejected by the top of the channel on July 27. However, it’s still trading in the upper portion of the channel.
Furthermore, technical indicators are relatively neutral. The MACD is decreasing but is still positive and the RSI is above 50, even though it’s falling.
A breakout from the channel would likely take it towards $2,850. Whether ETH breaks out from the channel or falls below the midline will likely determine the future direction of the trend.
XRP
On July 22, XRP broke out from a descending resistance line that had been in place since May 19. It’s currently attempting to move above the $0.70 resistance area.
Technical indicators are bullish, supporting the possibility that it will move above this area.
If this occurs, the next resistance level would be at $0.95. This target is the 0.382 Fib retracement resistance level.
DASH
DASH had been moving beneath a descending resistance line since May 19. On July 19, it managed to break out and reached a high of $190. The high was made right at the 0.618 Fib retracement resistance level.
DASH failed to sustain the highs and created a long upper wick (red icon).
While it has regained its footing, the MACD and RSI are both showing weakness.
The closest support area is found at $115.
ENJ
ENJ had been following a descending resistance line since May 26. It managed to break out on July 22, but has not initiated a significant upward move yet.
It’s currently attempting to move above the $1.43 horizontal resistance area.
Technical indicators are bullish. This is especially evident by the impending bullish cross in the Stochastic oscillator (green circle) and the MACD nearly moving above 0.
If successful in reclaiming this area, ENJ could increase all the way to $2.03.
RUNE
RUNE had been trading under a descending resistance line since May 27. While following the line, it fell to a low of $3.01 on July 20. However, it bounced shortly after and broke out above the resistance. It’s currently in the process of creating a significant bullish candlestick.
The closest resistance area is found at $7.
QNT
QNT has been moving upwards since July 20 after it reached a low of $55.30. On July 28, it managed to break out from the $96 resistance area and proceeded to reach a new all-time high price of $124.90.
The next closest resistance area is at $137.
For BeInCrypto’s latest BTC (BTC) analysis, click here.
The post BTC, ETH, XRP, DASH, ENJ, RUNE, QNT — Technical Analysis July 29 appeared first on BeInCrypto.


