BTC, ETH, XRP, DIA, DASH, ATOM, WAVES — Technical Analysis June 17
3 min readTable of Contents
BTC (BTC) is facing resistance at $41,250 while ETH (ETH) is trading inside a symmetrical triangle.
XRP (XRP) and Dash (DASH) are following descending resistance lines.
DIA (DIA) and Waves (WAVES) have bounced at long-term ascending support lines.
Cosmos (ATOM) has broken out from a descending resistance line.
BTC
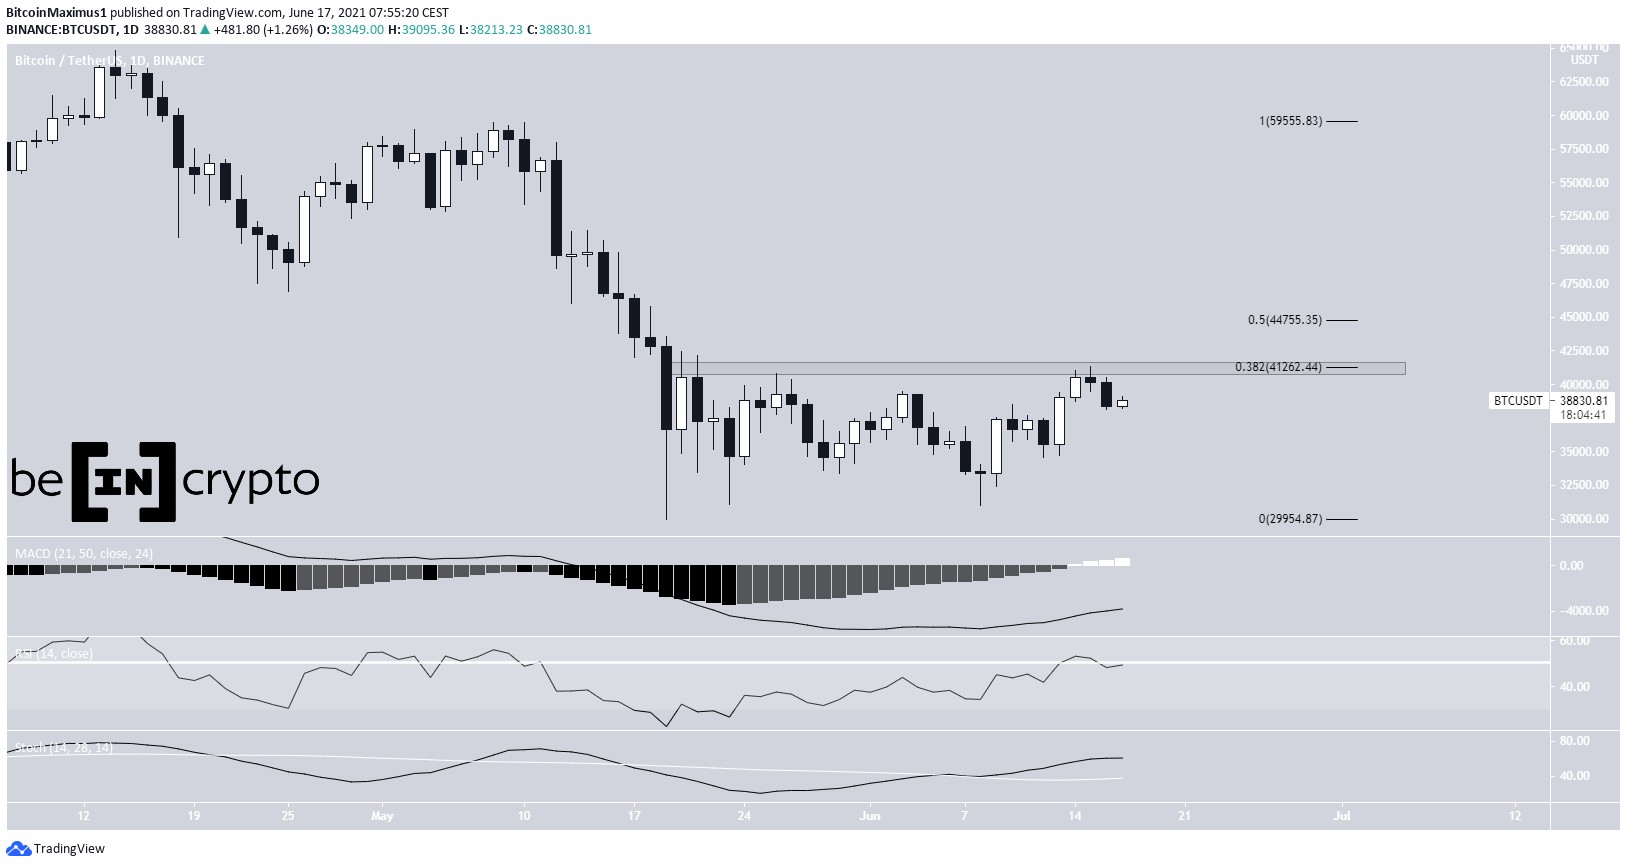
BTC reached a high of $41,330 on June 15. However, it has been decreasing since. The decrease occurred after a rejection by the $41,250 resistance area, which is the 0.382 Fib retracement resistance level.
Even though BTC has dropped, technical indicators in the daily time frame are firmly bullish. The MACD is positive and has created three momentum bars in positive territory. The RSI and Stochastic oscillator are also increasing. The latter has made a bullish cross while the former is above the 50-line. These indicators point to an eventual breakout.
The wave count suggests a high near $43,950 is likely.
ETH
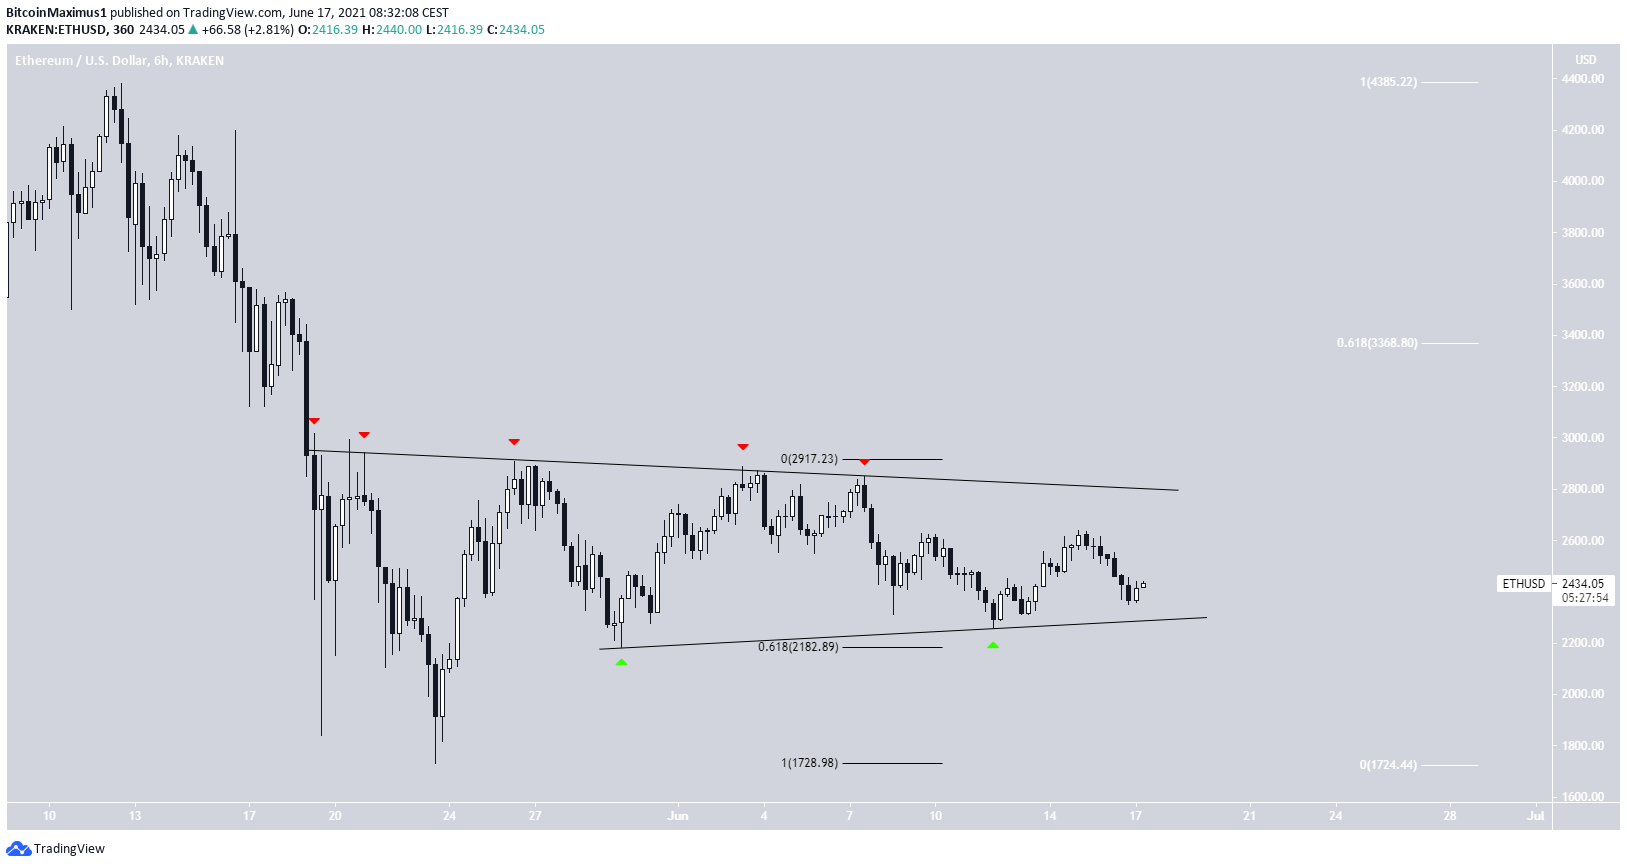
Since May 19, ETH has been rejected five times (red icons) by a descending resistance line. At the time, it had reached a local high of $3,017.
ETH has been following an ascending support line since May 30 when it rebounded from the 0.618 Fib retracement support level (green icon). Alongside the previously outlined resistance line, this creates a symmetrical triangle pattern.
If ETH were to break out, the most likely resistance would be the 0.618 Fib retracement resistance level at $3,368. Despite this, the long-term trend could still be bearish.
XRP
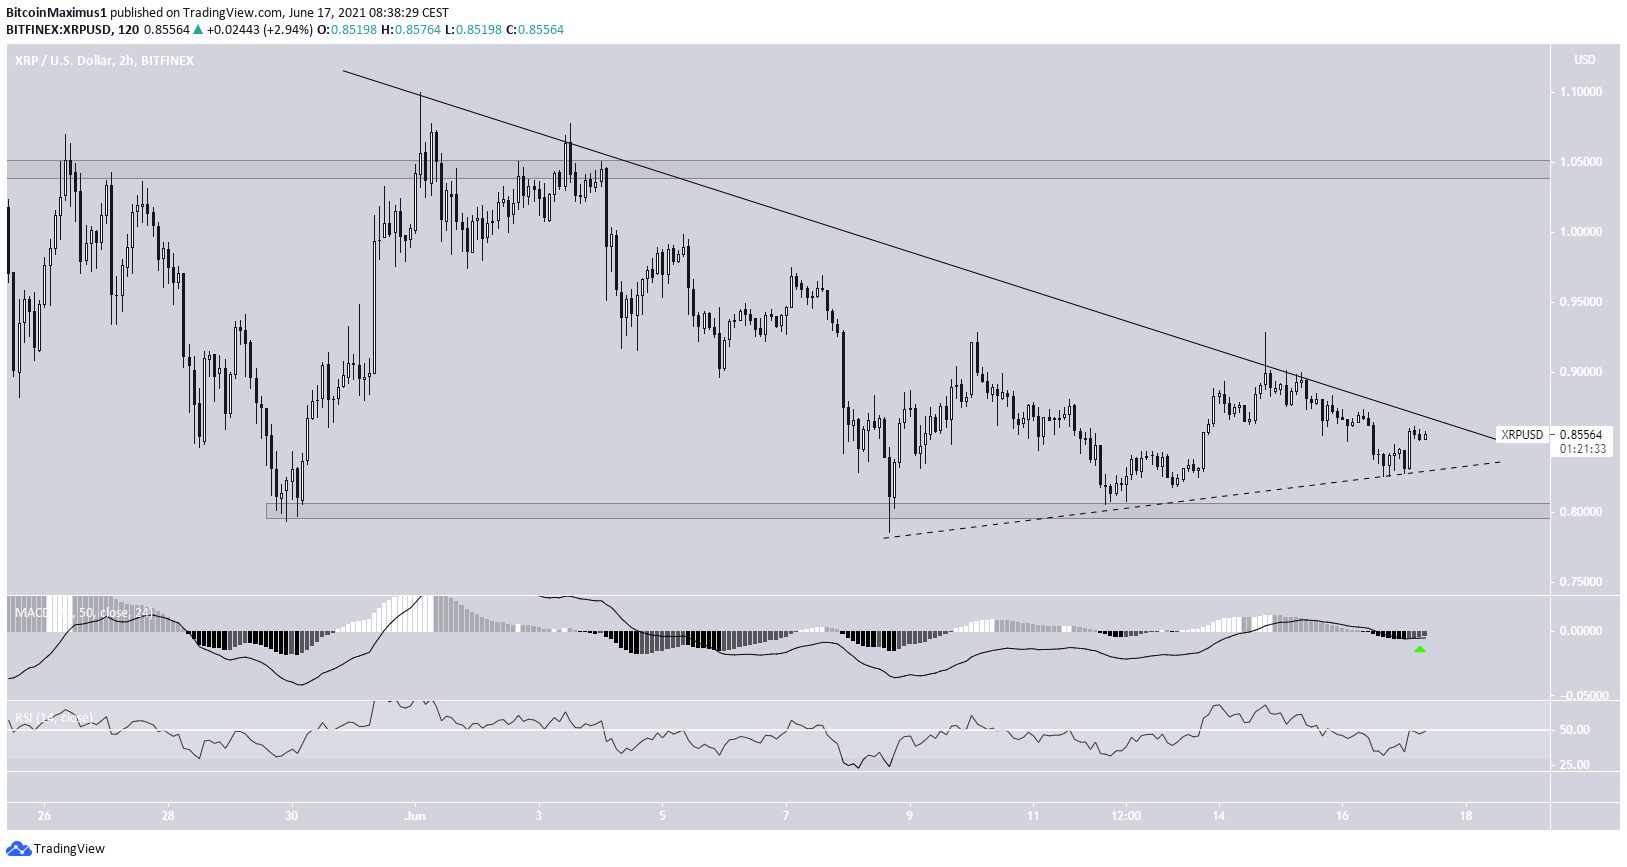
XRP has been decreasing alongside a descending resistance line since June 1. So far, it has made three unsuccessful breakout attempts.
There is support at $0.80, created by the May 29 lows. XRP initially bounced above this support on June 8. Since then, it’s been making slightly higher highs alongside an ascending support line (dashed). In addition to this, the two-hour MACD has provided a bullish reversal signal and the RSI is close to doing the same.
Therefore, an eventual breakout seems likely. If so, another revisit of the $1.04 resistance area could occur.
DIA
On May 23, DIA bounced after reaching a low of $1.25. The low validated a long-term ascending support line for the fifth time. The line has been in place since October 2020.
After an ensuing bounce and decrease, DIA created a higher low on June 12 and has been moving upwards since. The low was combined with a bullish divergence in both the RSI and MACD.
Therefore, an upward movement is likely. If so, the closest resistance area is found near $3. This target is the 0.382 Fib retracement resistance level.

DASH
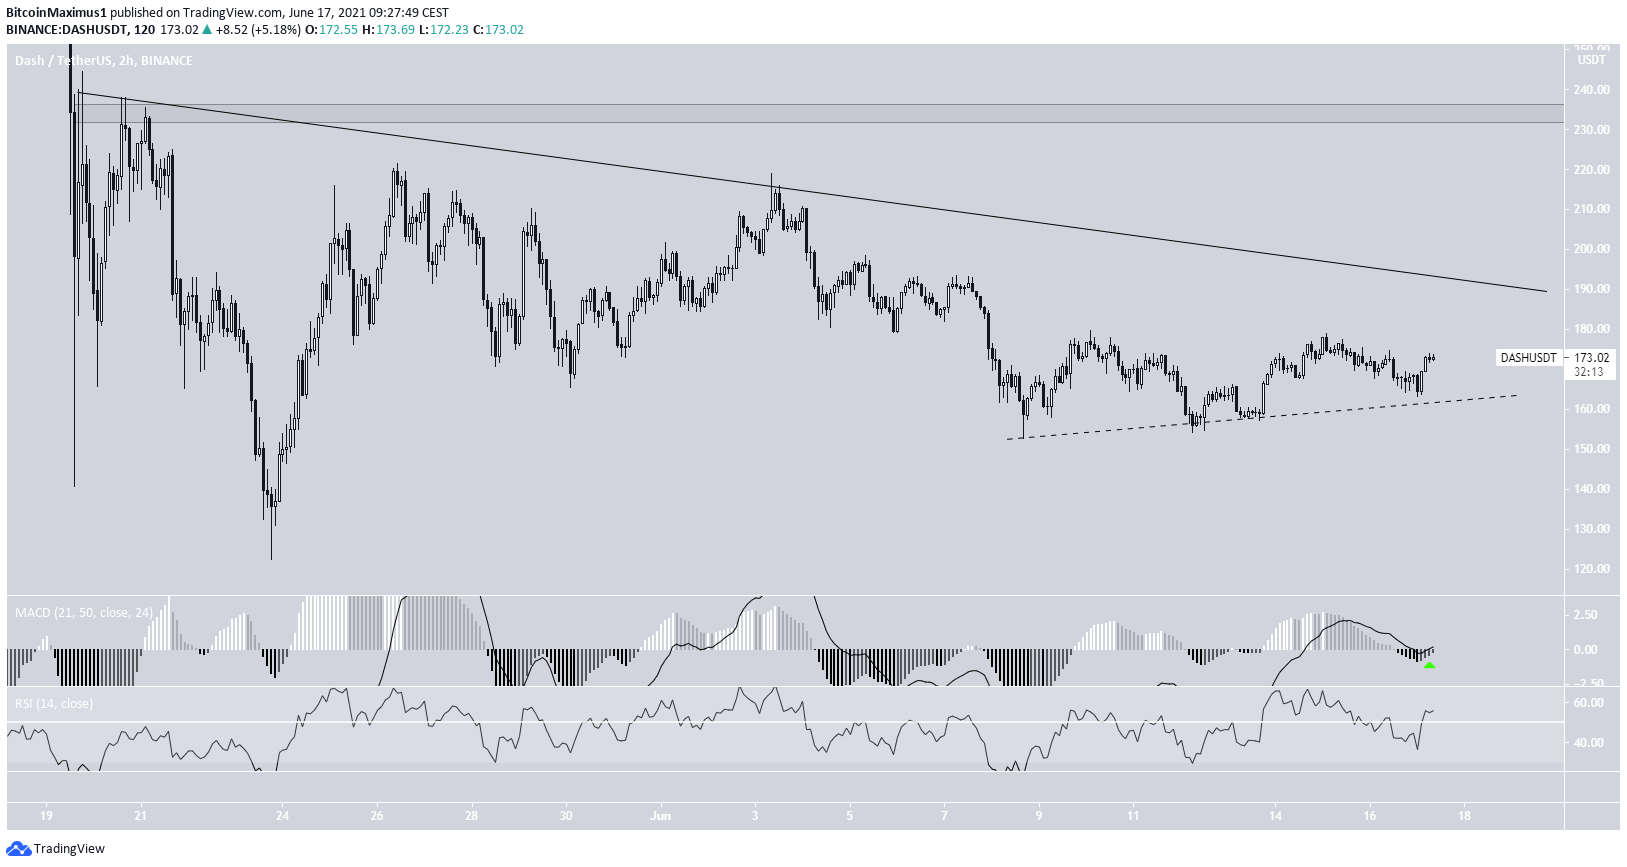
DASH has been decreasing alongside a descending resistance line since May 19.
The movement is very similar to that of XRP, in that it’s been making higher lows since June 8. In addition, the RSI has moved above 50 and the MACD has given a bullish reversal signal.
Therefore, a movement towards the resistance line and potential breakout would be expected.
In that case, the next closest resistance area would be found near $235.
ATOM
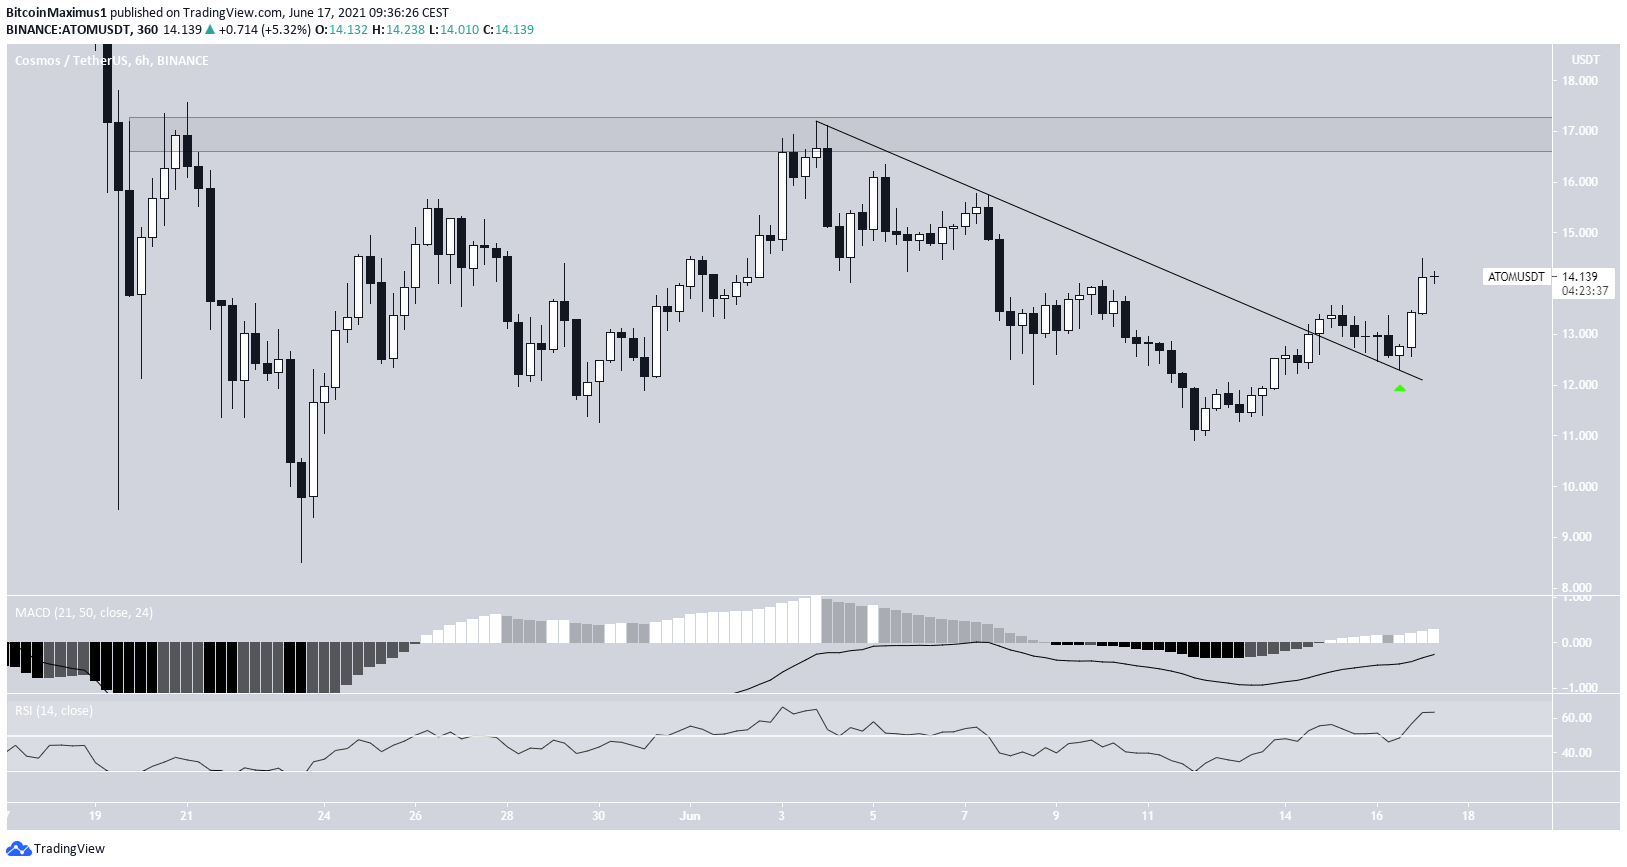
ATOM has been decreasing alongside a descending resistance line since June 3. After three unsuccessful attempts, it managed to break out on June 14.
Following this, it validated the line as support two days later (green icon) and has begun another upward movement.
Both the RSI and MACD are increasing, supporting the continuation of the upward movement toward the $17 resistance area.
This level had previously been reached on May 20 and June 3.
WAVES
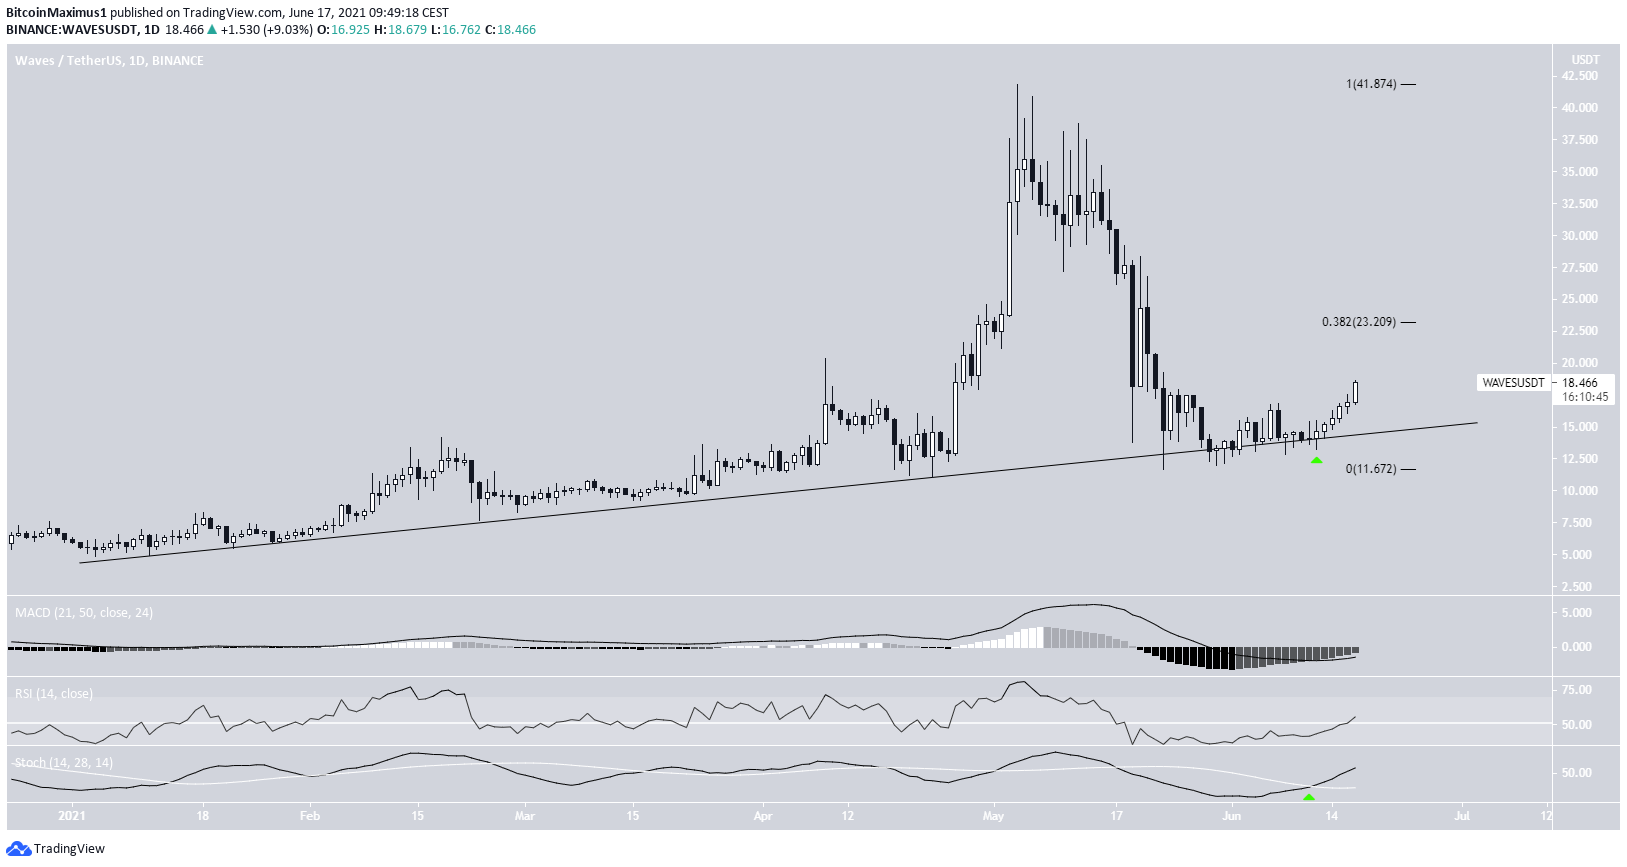
On May 23, WAVES reached a low of $11.68, validating a long-term ascending support line that has been in place since the beginning of the year.
After creating several higher lows, it initiated an upward move on June 12.
Technical indicators are bullish, supporting the continuation of the upward movement. The RSI has moved above 50 and the Stochastic oscillator has made a bullish cross (green icon). In addition, the MACD is close to reaching positive territory.
The closest resistance area is found at $23.20. This is the 0.382 Fib retracement resistance level.
For BeInCrypto’s latest BTC (BTC) analysis, click here.
The post BTC, ETH, XRP, DIA, DASH, ATOM, WAVES — Technical Analysis June 17 appeared first on BeInCrypto.


