BTC, ETH, XRP, XMR, CRV, KSM, NEAR—Technical Analysis June 1
3 min readTable of Contents
BTC (BTC) is trading inside a symmetrical triangle.
ETH (ETH) and Curve Dao Token (CRV) have broken out from descending resistance lines.
XRP (XRP) is trading inside a descending parallel channel.
Monero (XMR) has fallen below the long-term $410 support area.
Kusama (KSM) has reclaimed the $280 support area.
Near Protocol (NEAR) has bounced at the $2.70 support area.
BTC
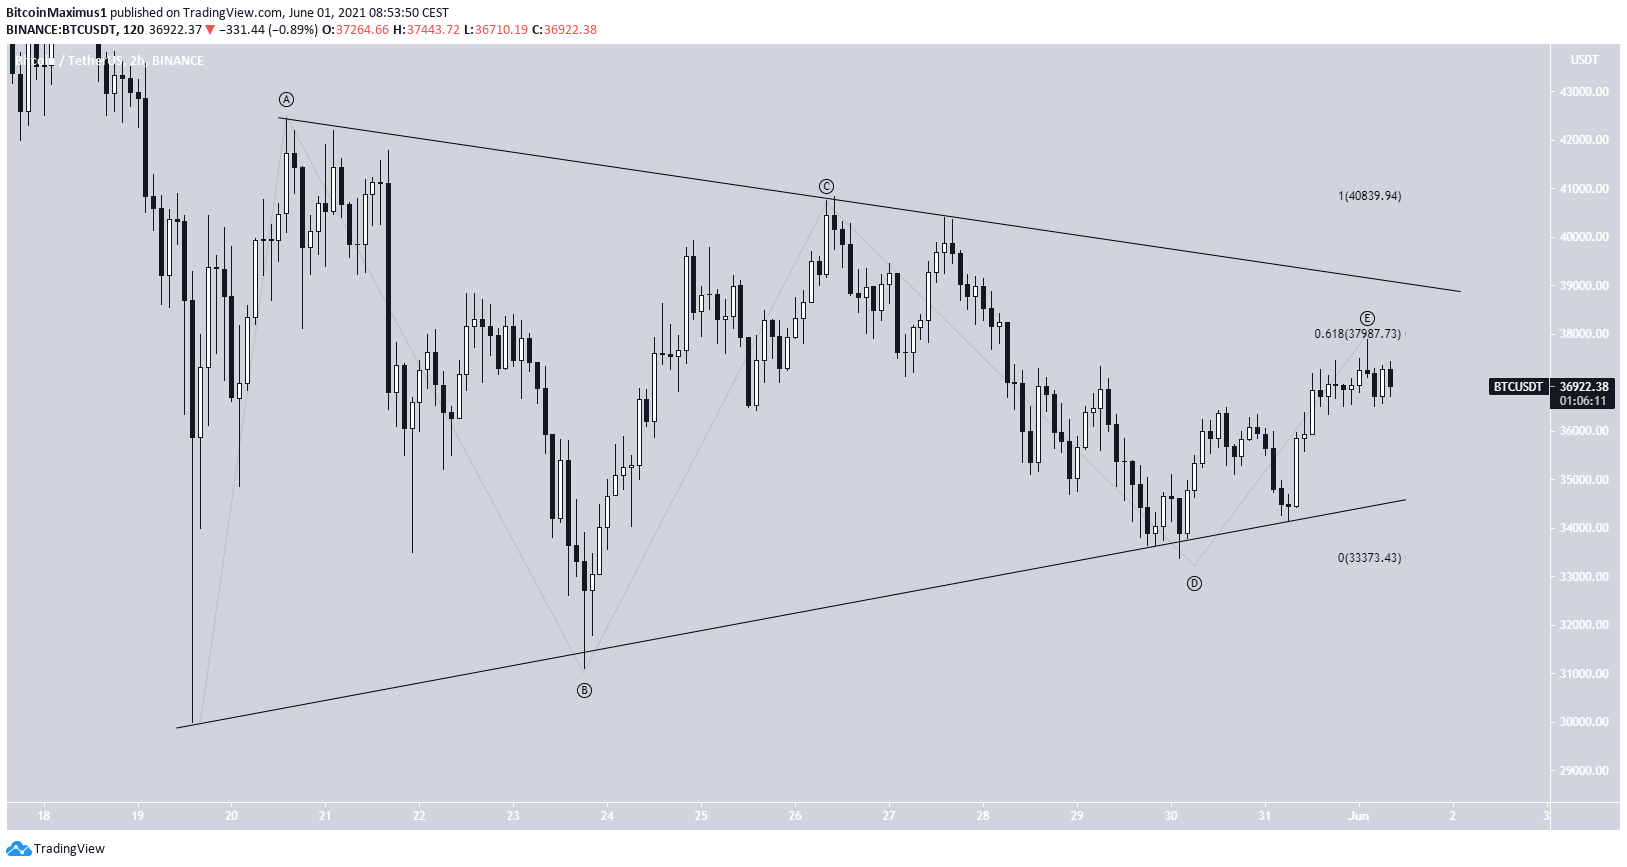
BTC is trading inside a symmetrical triangle since reaching a local bottom on May 19. This is normally considered a neutral pattern.
BTC was rejected near $38,000, which is the 0.618 Fib retracement resistance level. Therefore, if the movement is part of wave four, it is possible that a top has been reached.
On the other hand, a breakout could indicate that the correction is complete and BTC is heading higher.
Instead, a breakout from the triangle would go a long way in suggesting that BTC has completed its correction instead of the movement being part of wave four.
For a more in-depth analysis, click here.
ETH
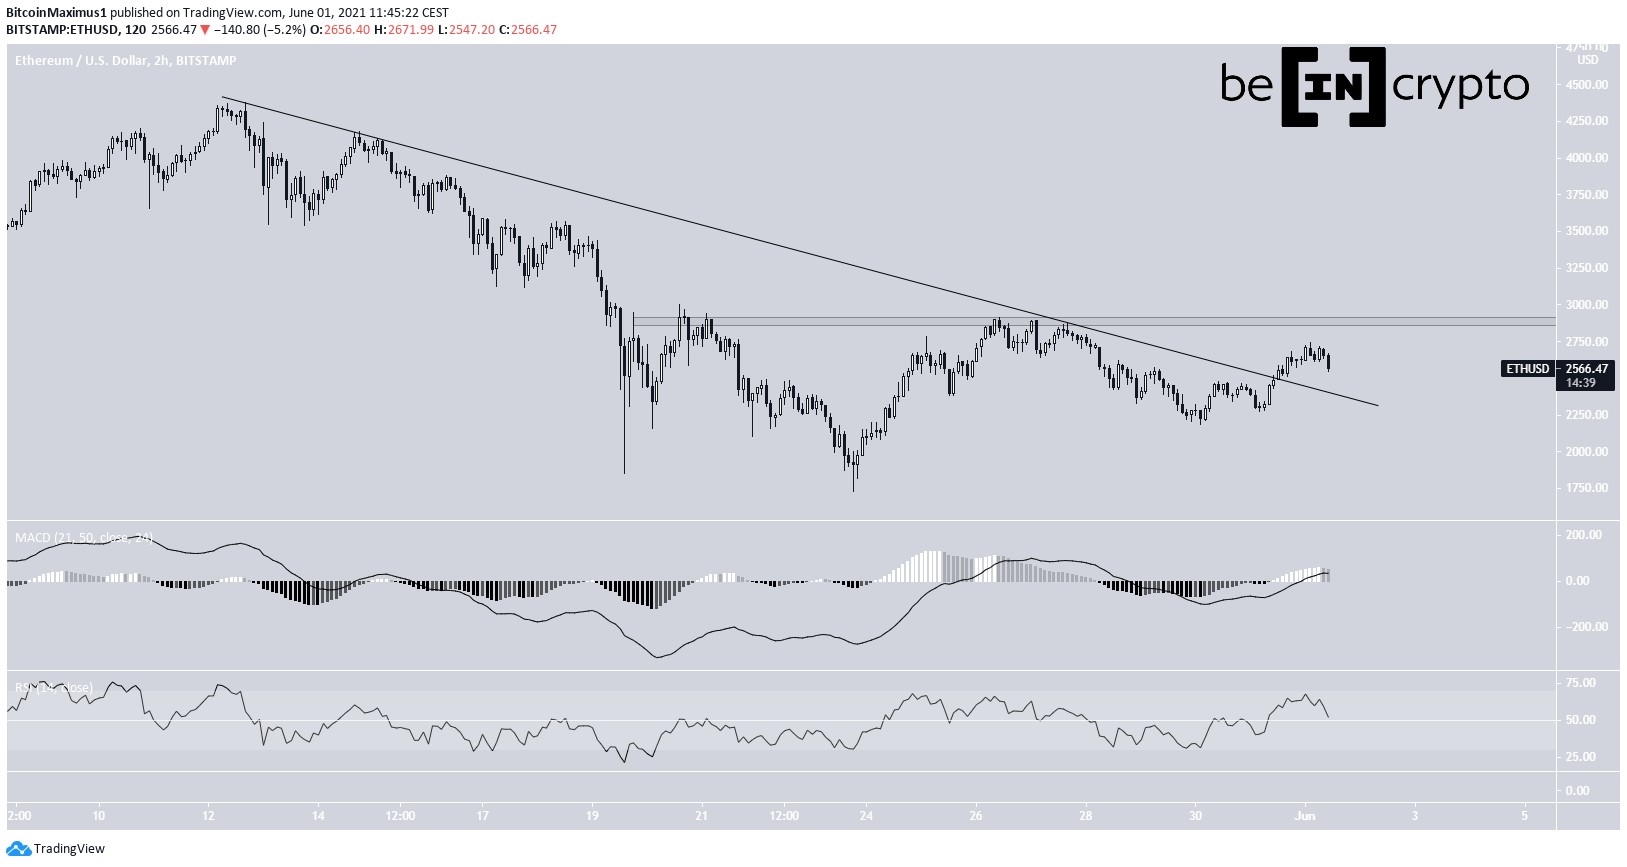
ETH has been following a descending resistance line since reaching an all-time high price on May 12. On May 30, it managed to break out above this line.
The main horizontal resistance area is found at $2,850.
Technical indicators are bullish, considering the positive MACD and RSI cross above 50.
Therefore, it’s likely that ETH will test this resistance once again.
XRP
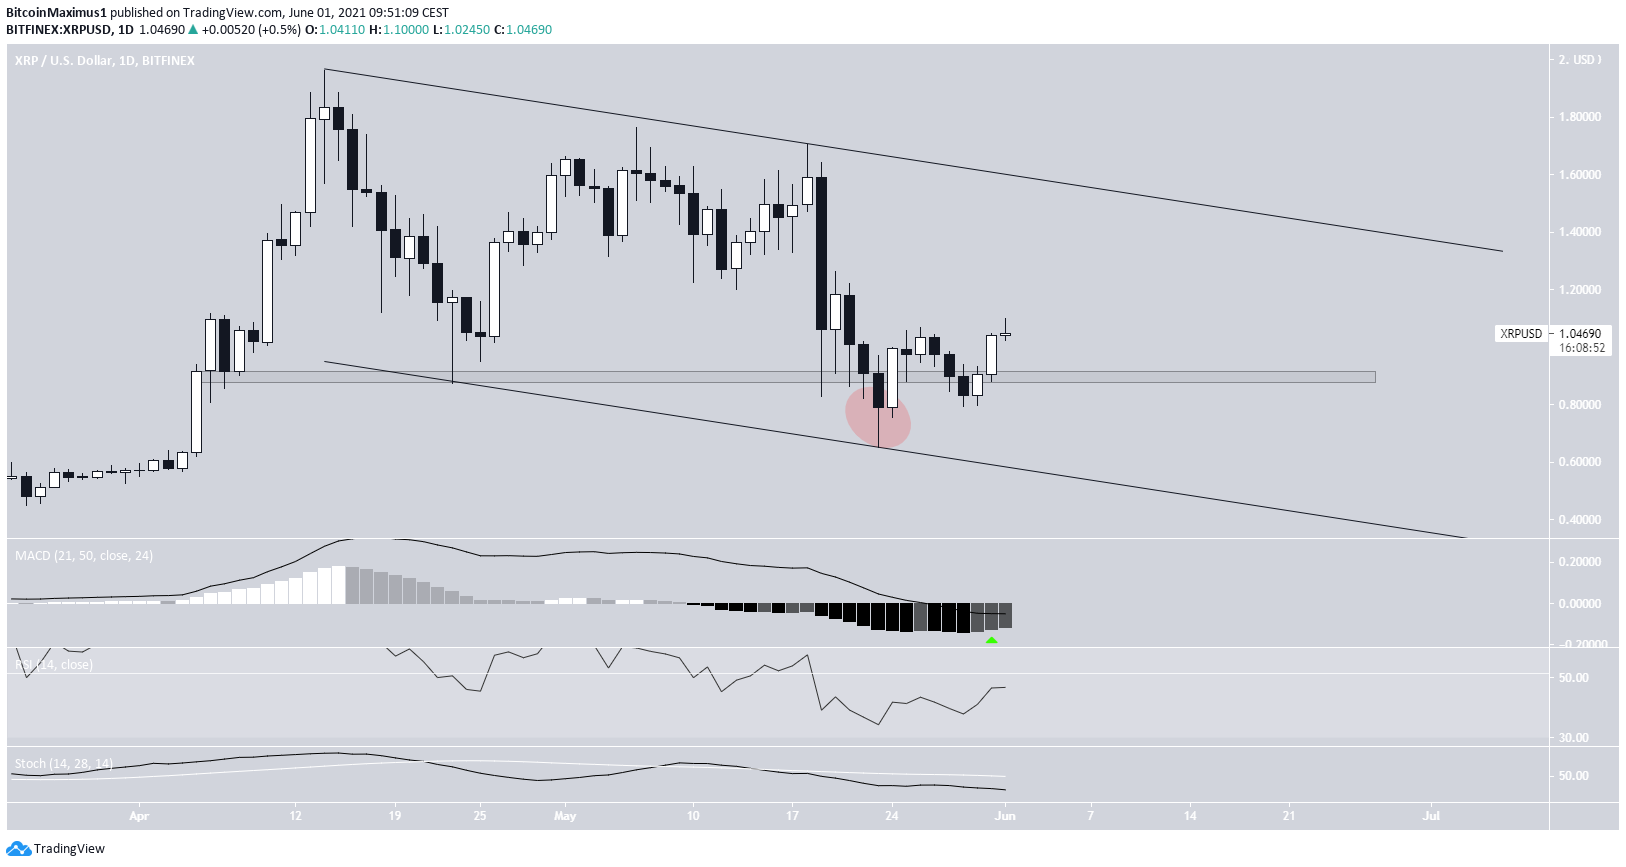
XRP has been trading inside a descending parallel channel since April 14. Presumably, this is a corrective movement.
Initially, XRP fell below the $0.90 support area. However, it bounced after touching the support line (red circle) and reclaimed the support area shortly after.
Technical indicators are providing some bullish signs, as is visible by the bullish reversal signal in the MACD.
There is strong resistance at $1.46, created by the resistance line of the channel.
XMR
XMR reached an all-time high price of $517 on May 17. However, it fell sharply immediately after.
While the $410 area was expected to act as support, the price fell right through it instead.
Furthermore, technical indicators have turned bearish. This is evident by the RSI cross below 70 and the bearish cross in the Stochastic oscillator.
Until the $410 area is reclaimed, the trend cannot be considered bullish.

CRV
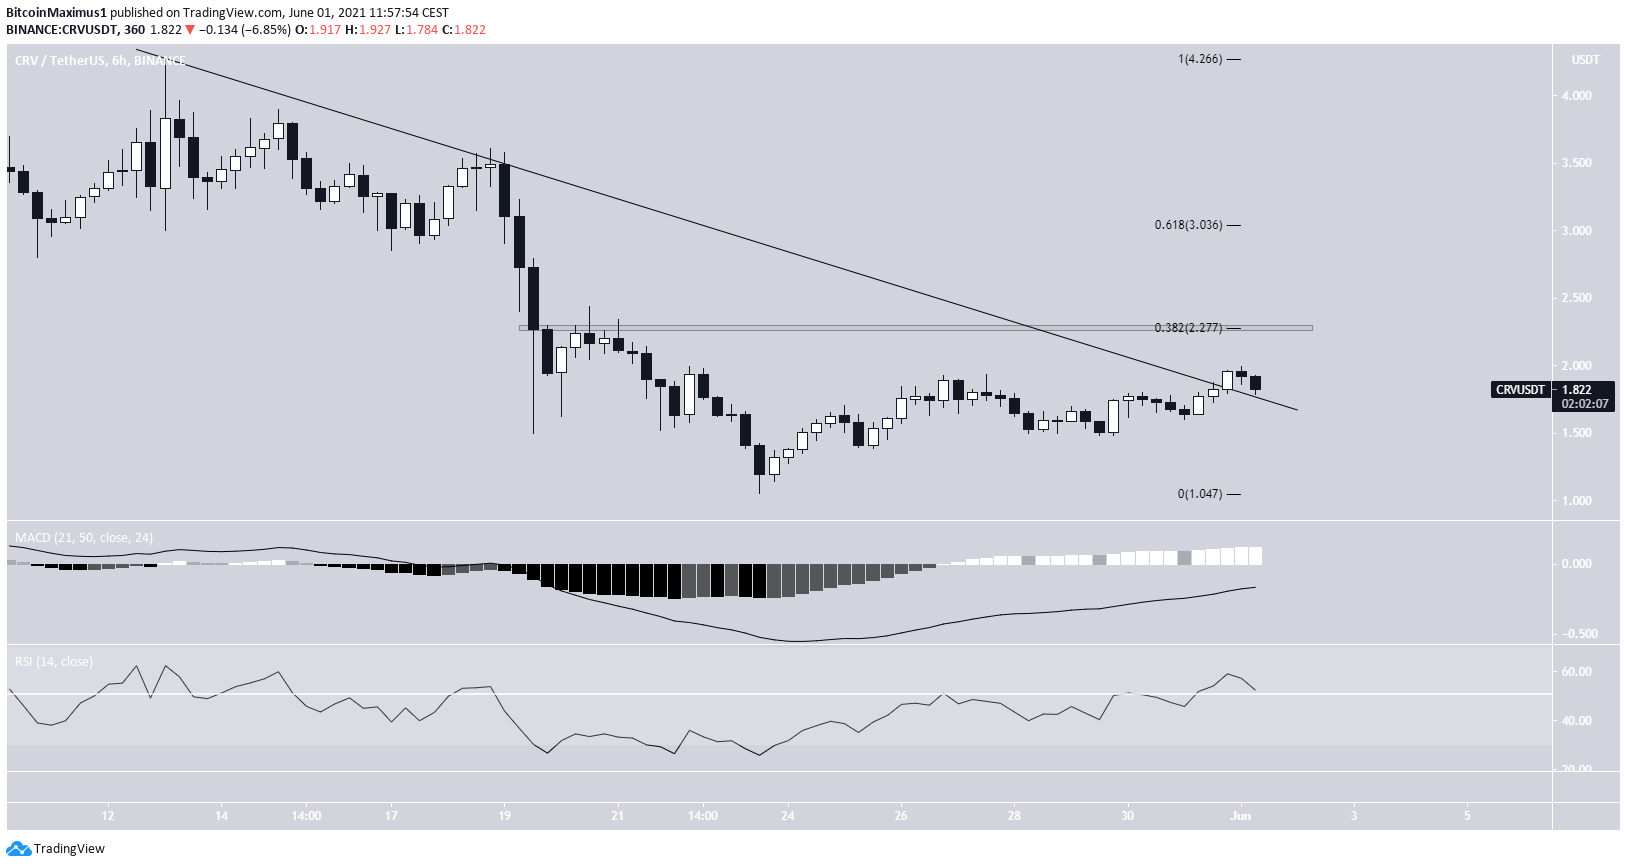
CRV had been following a descending resistance line since May 13. After some unsuccessful attempts, it broke out on May 29.
It’s now in the process of validating the level as support (green icon). If successful, an upward movement towards the $2.27 and potentially $3.04 resistance levels would be expected.
This movement is supported by the positive movements in the MACD and RSI.
KSM
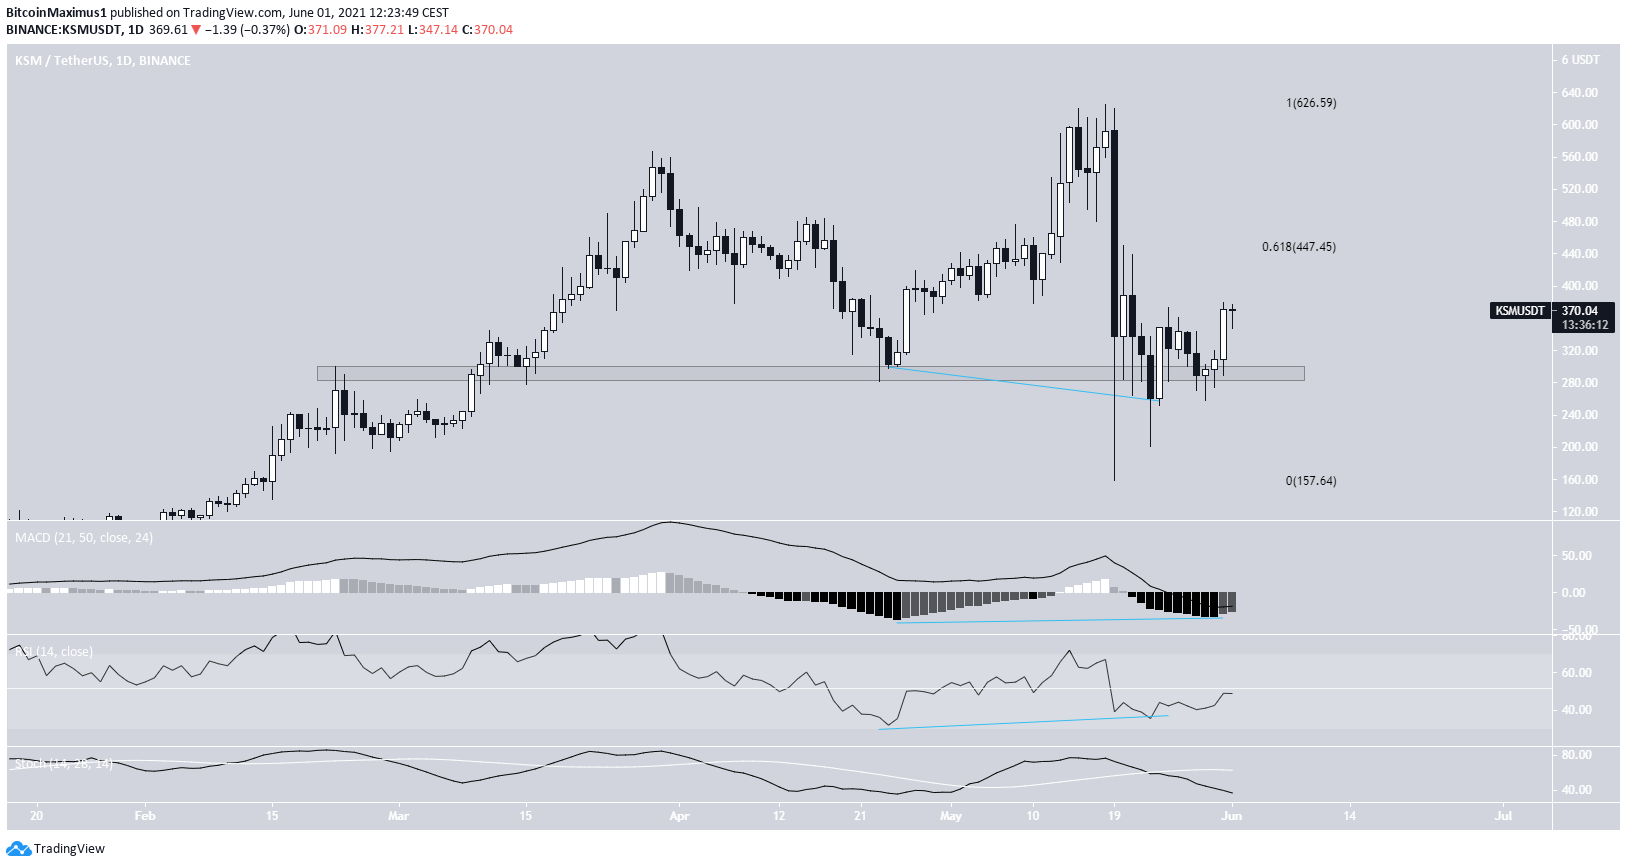
KSM has been decreasing since May 18, after it reached an all-time high price of $618. The next day, it fell to a low of $158.75.
However, it bounced immediately after to reclaim the $280 area.
Technical indicators are bullish despite the bearish cross in the Stochastic oscillator. Both the MACD and RSI have generated bullish divergences and are moving upwards.
Therefore, it’s likely that KSM reaches the next resistance area at $447.
NEAR
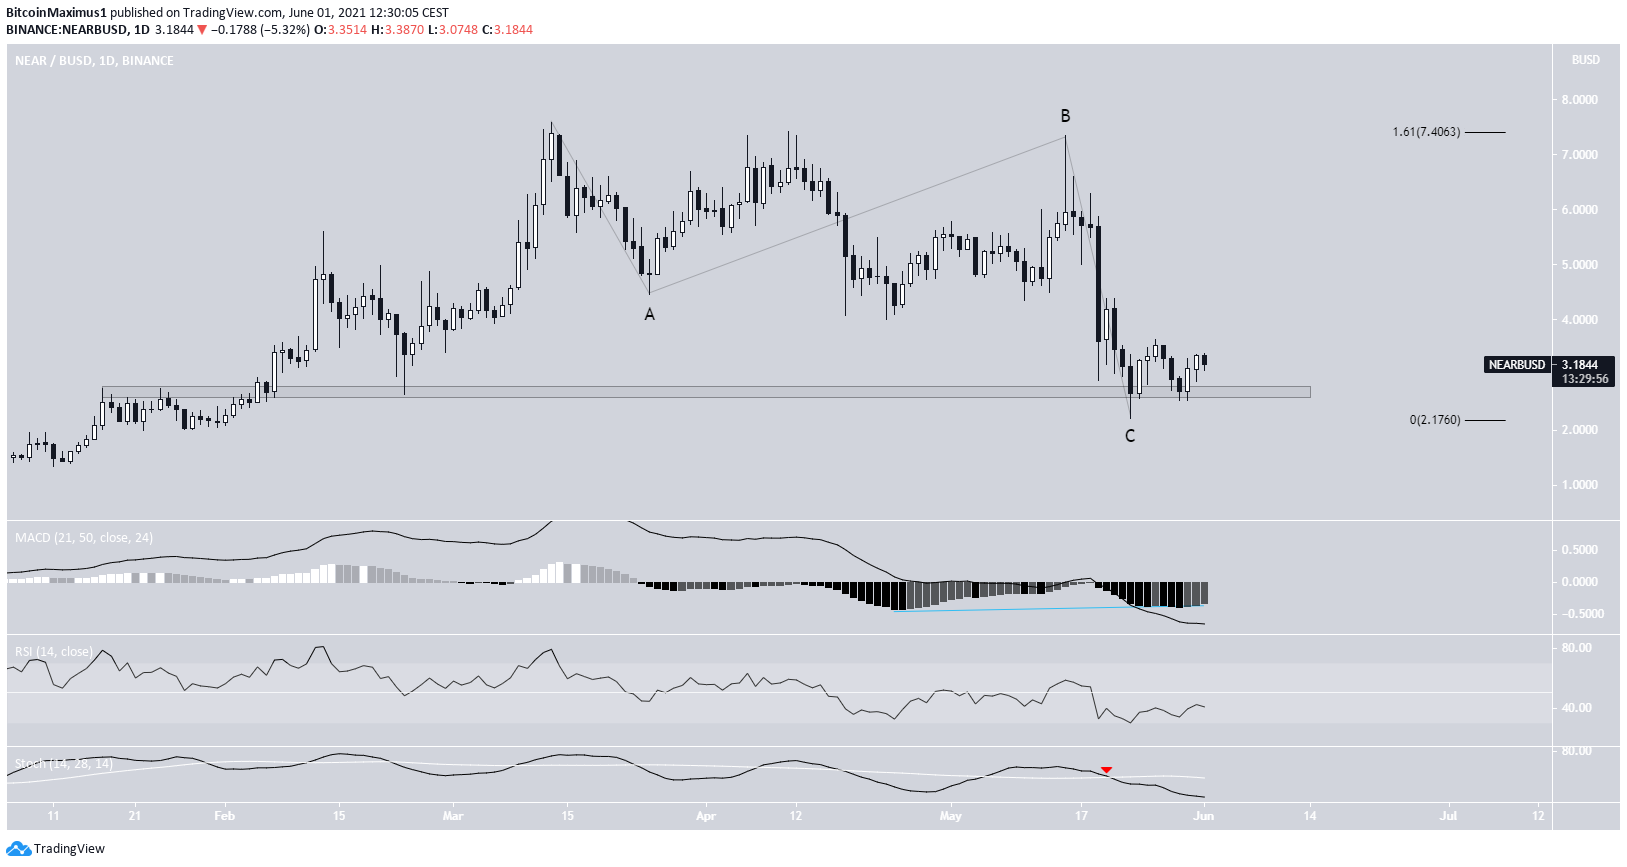
NEAR has been moving downwards since March 13 after reaching an all-time high price of $7.59. It created a lower high on May 15 before falling once more.
At the time of press, it was trading just above the $2.70 support area. Technical indicators provide mixed signs. The MACD has generated q bullish divergence (blue line), but both the RSI and Stochastic oscillator are bearish (red icon).
However, the decrease looks like a completed A-B-C correction (black), in which waves A:C had a 1:1.61 ratio. If true, an upward move would be expected.
An increase above the A wave low (red line) at $4.46 would confirm the correction is completed.
For BeInCrypto’s latest BTC (BTC) analysis, click here.
The post BTC, ETH, XRP, XMR, CRV, KSM, NEAR—Technical Analysis June 1 appeared first on BeInCrypto.


