Table of Contents
BTC (BTC) is in the process of breaking down from an ascending support line.
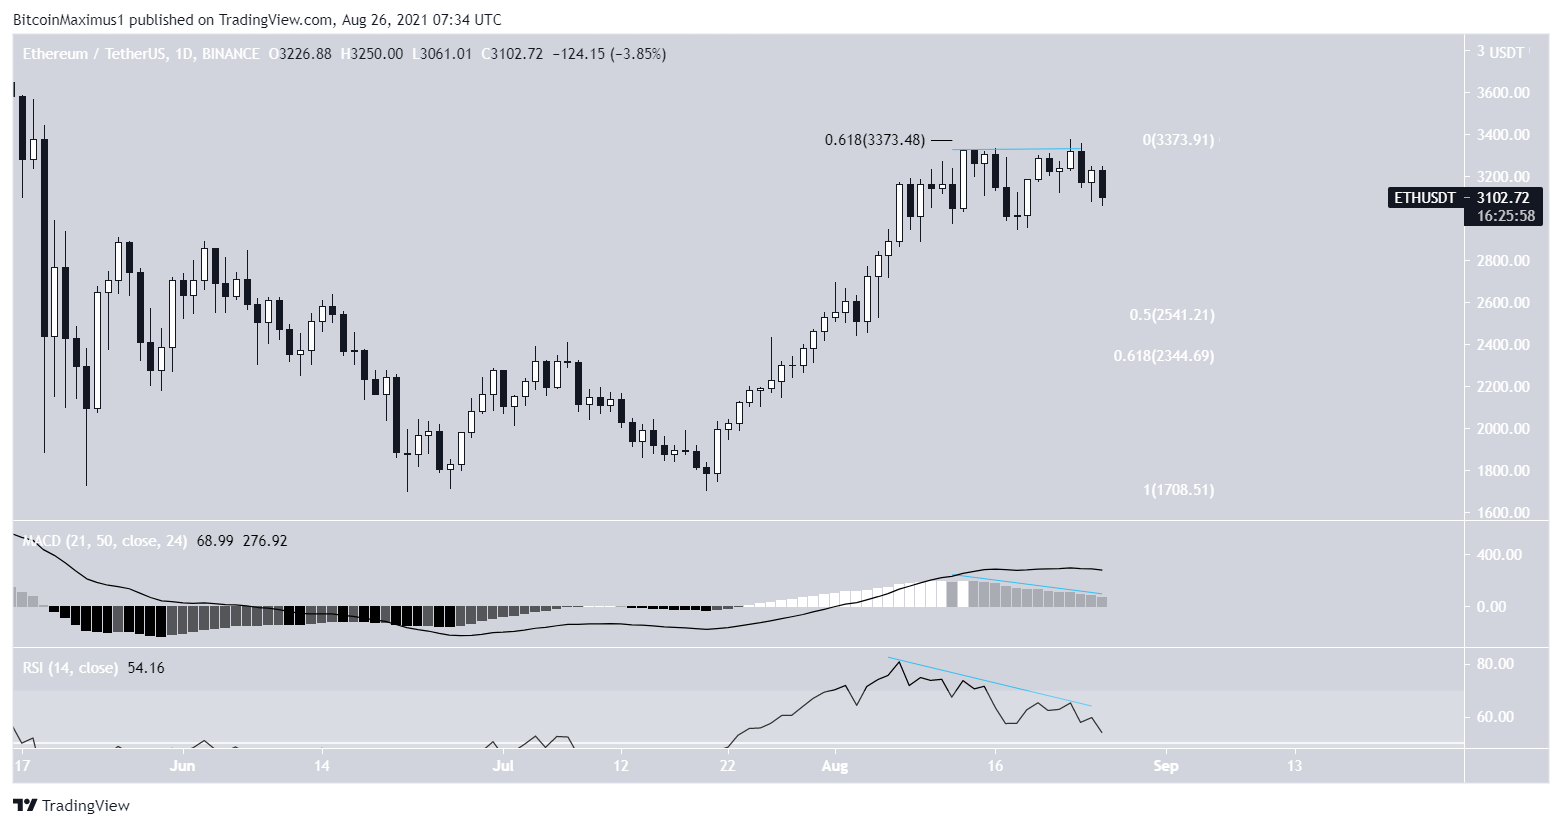
ETH (ETH) has created a double top pattern.
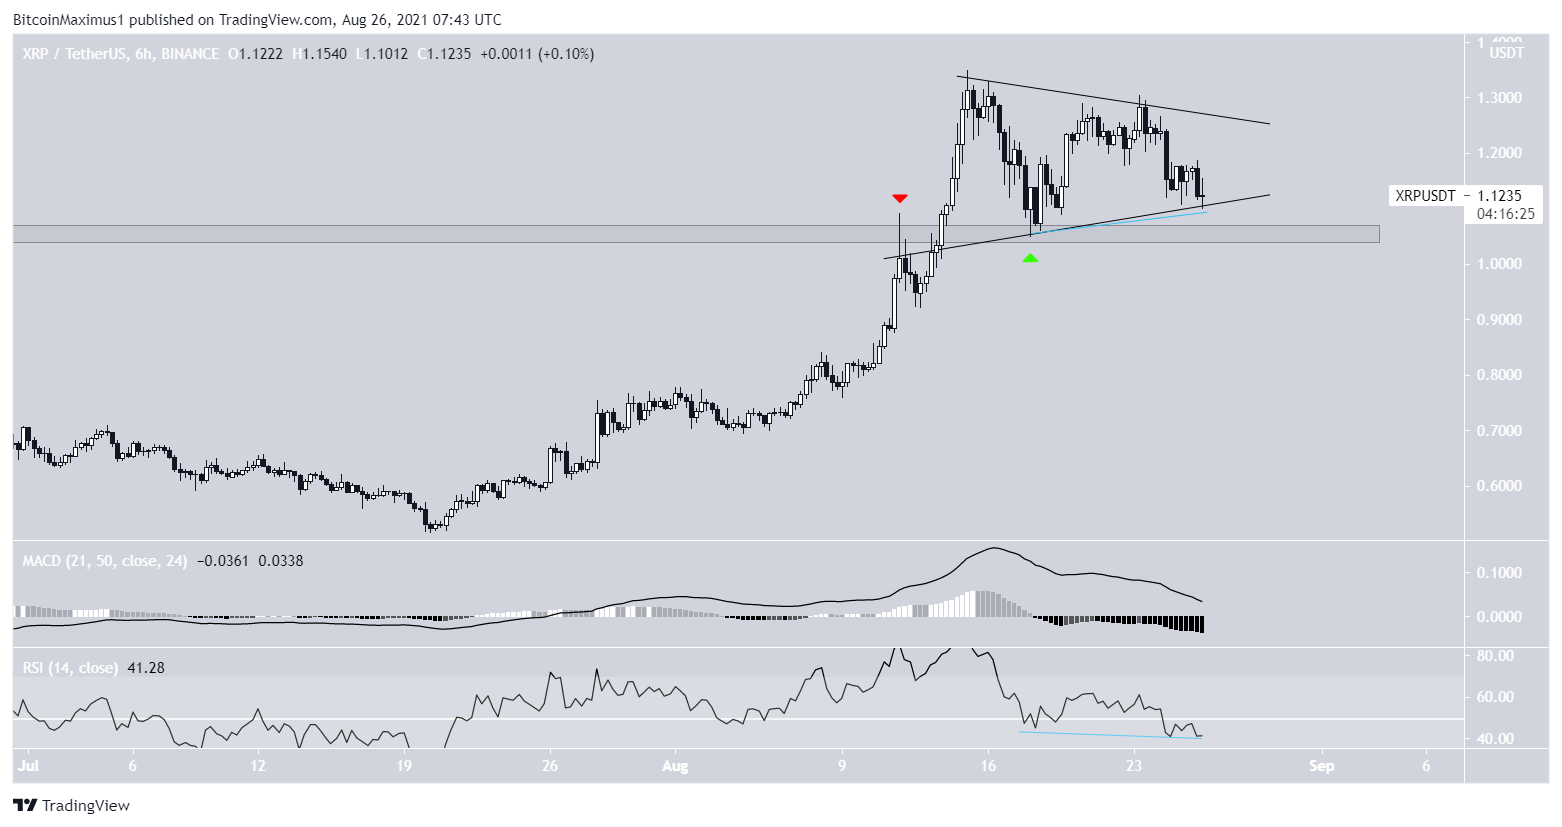
XRP (XRP) is potentially trading inside a symmetrical triangle.
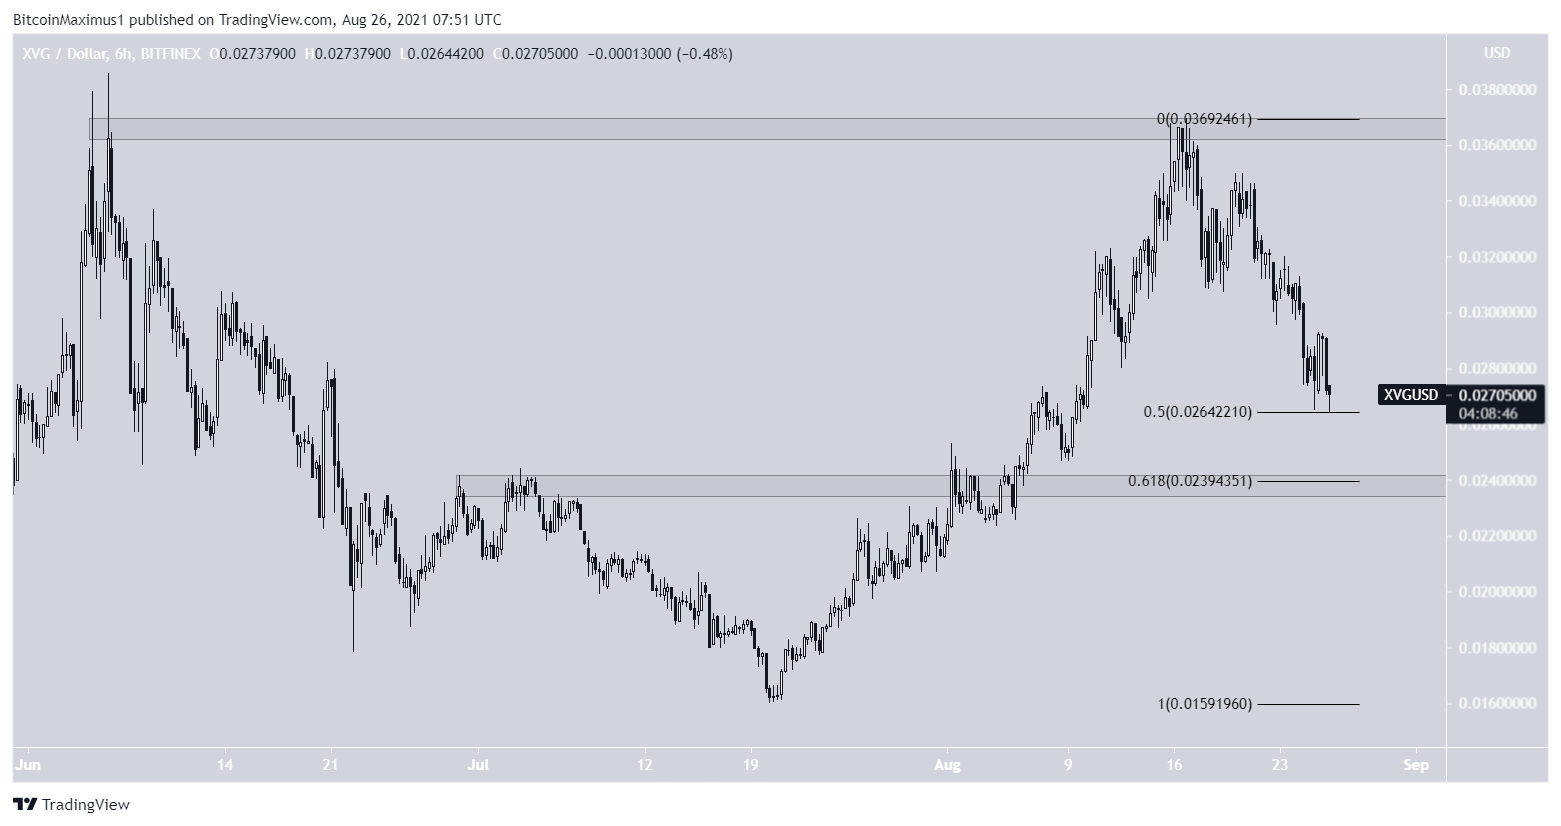
Verge (XVG) is trading between support and resistance at $0.024 and $0.0365.
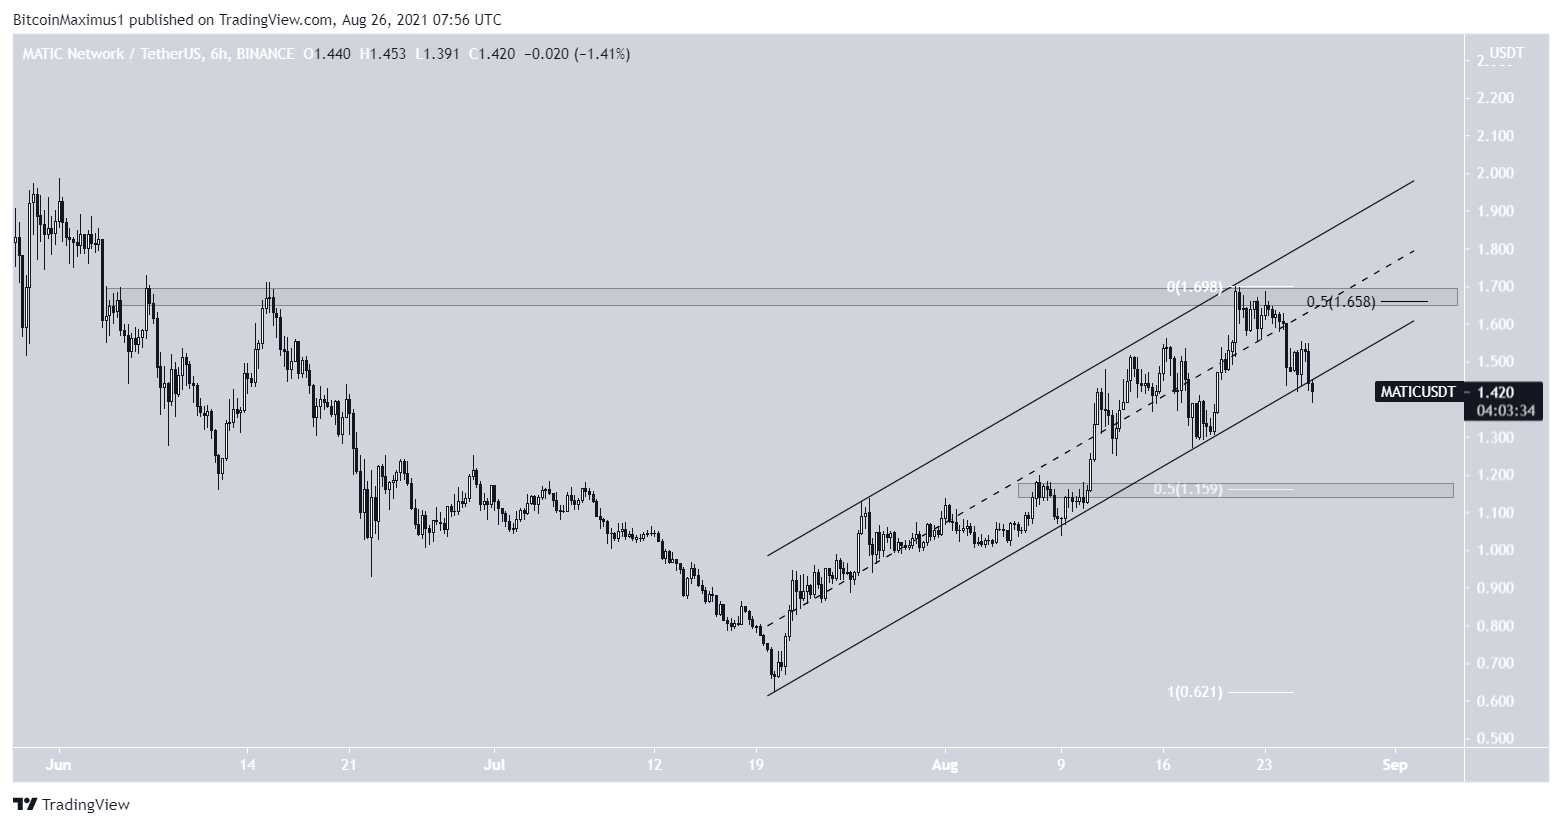
Polygon (MATIC) has been rejected by the $1.66 resistance area.
Dogecoin (DOGE) is following an ascending support line.
COTI Network (COTI) has broken out from a descending parallel channel.
BTC
BTC has been falling since Aug 23, after it reached a local high of $50,500. After completing an evening star candlestick pattern, it is in the process of creating a bearish engulfing candlestick.
The ongoing decrease was preceded by significant bearish divergences in the MACD, RSI, and Stochastic oscillator.
If the downward movement continues, the closest support level is found at $42,400. This target is the 0.382 Fib retracement support level and a horizontal support area.
ETH
On Aug 13, ETH reached a local high of $3,327. After a slight drop, it reached a slightly higher high of $3,377 on Aug 23.
However, ETH was rejected by the 0.618 Fib retracement resistance level and created a double top pattern. Furthermore, the pattern was combined with bearish divergences in both the RSI and MACD.
If it continues to fall, ETH could find support between $2,345 and $2,545. These are the 0.5-0.618 Fib retracement support levels (white).
XRP
XRP broke out from the $1.05 horizontal area on Aug 13 and validated the level as support (green icon) after.
Currently, it’s consolidating above this area and is potentially trading inside a symmetrical triangle.
The symmetrical triangle is often considered a neutral pattern. In addition to this, technical indicators are mixed. The MACD is negative but the RSI has generated a hidden bullish divergence.
If a breakout were to occur, the next resistance would be found at $1.65.
XVG
XVG has been decreasing since Aug 16, when it was rejected by the $0.0365 resistance area.
It’s currently trading just above the $0.0.264 support, which is the 0.5 Fib retracement support level. However, the main support area is found at $0.024. This target is the 0.618 Fib retracement support level and a horizontal support area.
Currently, there are no bullish reversal signs in place.
MATIC
MATIC has been increasing alongside an ascending parallel channel since July 20. On Aug 21, it reached a high of $1.70.
However, it decreased shortly after, confirming the rejection from the $1.66 resistance area. Besides being a horizontal resistance area, it’s also the 0.5 Fib retracement resistance level.
As a result, MATIC is breaking down from the ascending parallel channel. If the downward movement continues, the closest support would be found at $1.16.
DOGE
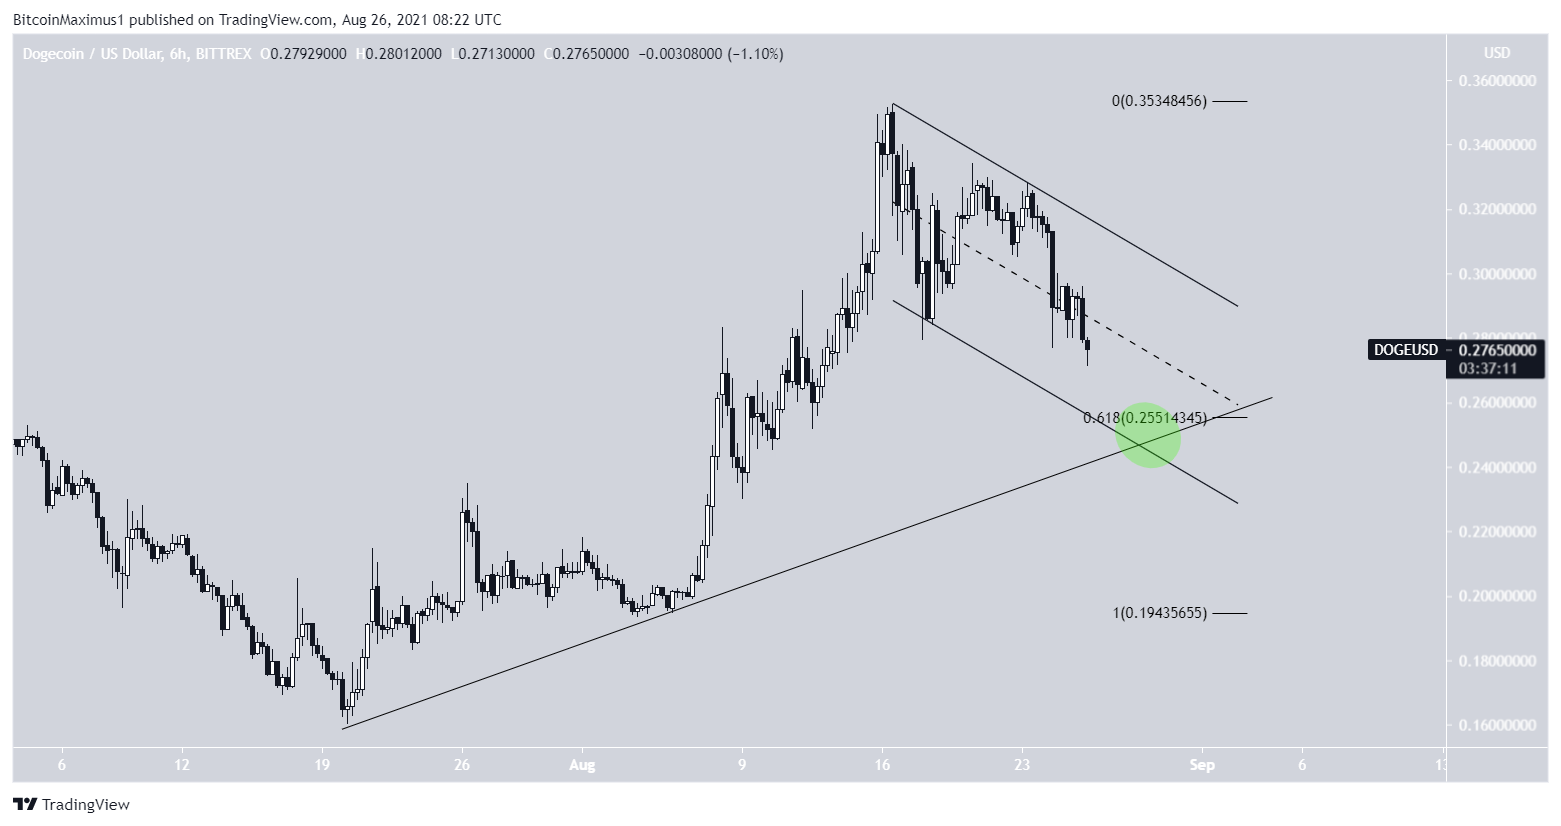
DOGE has been falling since reaching a high of $0.352 on Aug 16. The downward movement has taken the shape of a descending parallel channel, which usually contains corrective structures.
There is a very strong confluence of support levels at $0.255, created by:
- An ascending support line
- The support line of the parallel channel
- The 0.618 Fib retracement support level
Therefore, a bounce would be likely if DOGE reaches this support.
COTI
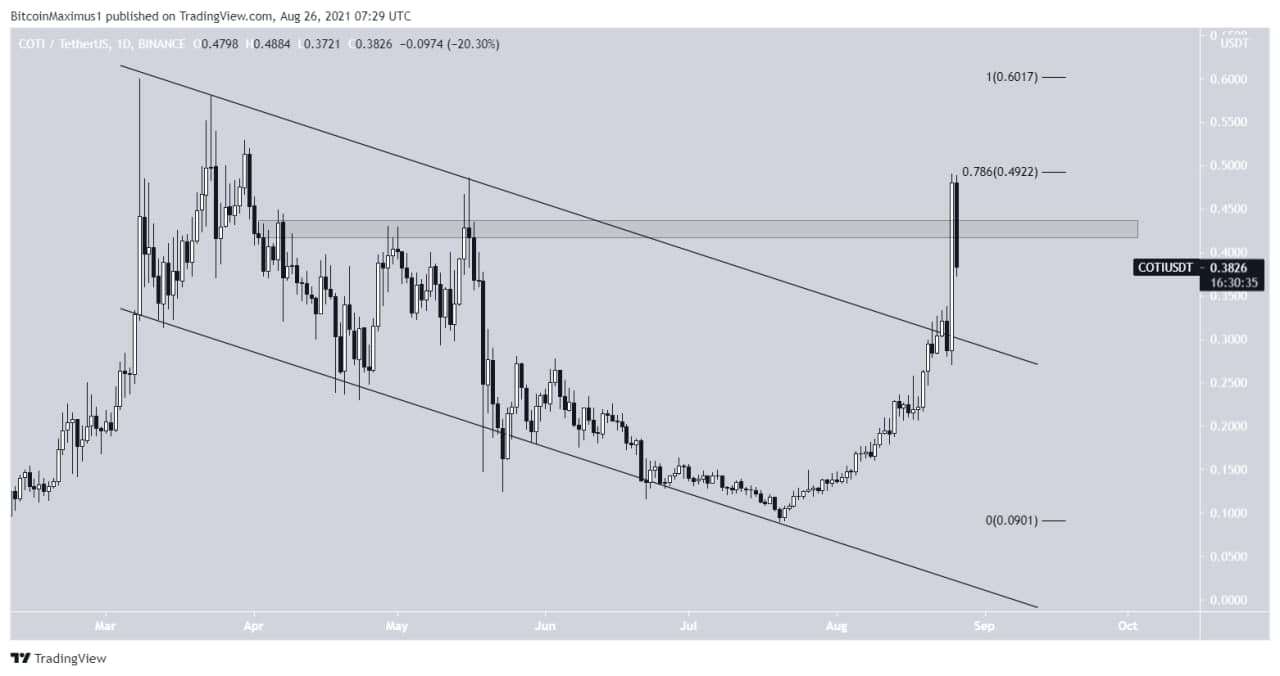
COTI had been trading inside a descending parallel channel since March 18. It began an upward move on July 20 and proceeded to break out from the channel on Aug 24.
While COTI accelerated at a rapid pace after the breakout, it was rejected by the 0.786 Fib retracement resistance level at $0.49.
Following this, it fell below the horizontal $0.42 resistance area.
Whether or not COTI manages to reclaim this level will likely determine the direction of the future trend.
For BeInCrypto’s latest BTC (BTC) analysis, click here.
The post BTC, ETH, XRP, XVG, MATIC, DOGE, COTI — Technical Analysis Aug 26 appeared first on BeInCrypto.


