BTC, ETH, XRP, ZEC, TFUEL, YFI, QTUM—Technical Analysis June 10
3 min readTable of Contents
BTC (BTC) created a bullish engulfing candlestick on June 9.
ETH (ETH) is trading inside a symmetrical triangle.
XRP (XRP) and Yearn.Finance (YFI) are following descending resistance lines.
Zcash (ZEC) has reclaimed the $120 support area.
Theta Fuel (TFUEL) reached a new all-time high price on June 9.
Qtum (QTUM) has bounced at the $8.40 support area.
BTC
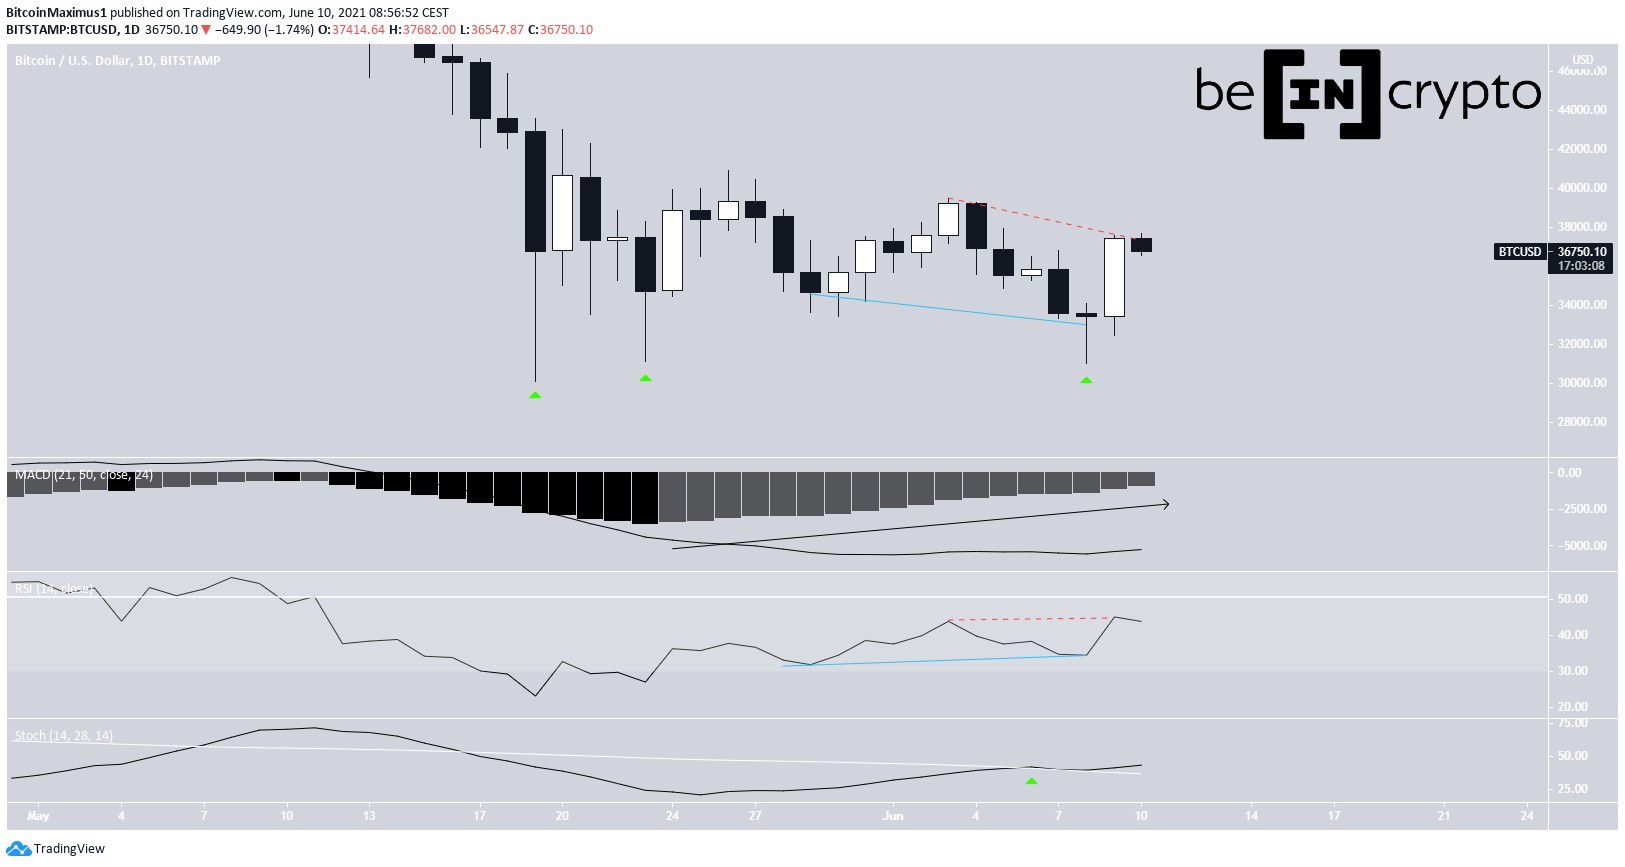
BTC has been increasing since rebounding on June 9. Similar to May 19 and 23, it created a long lower wick. The next day, it created a bullish engulfing candlestick and has been moving upwards since.
However, technical indicators are providing mixed signs. The RSI followed up a bullish divergence (blue) with a hidden bearish divergence (red) and is still below 50.
Nevertheless, the Stochastic oscillator has just made a bullish cross.
The next resistance levels are found at $41,400, $44,900, and $48,400.
While the exact wave count is not clear, both the bearish and bullish counts suggest a short-term increase towards the first resistance area will follow.
ETH
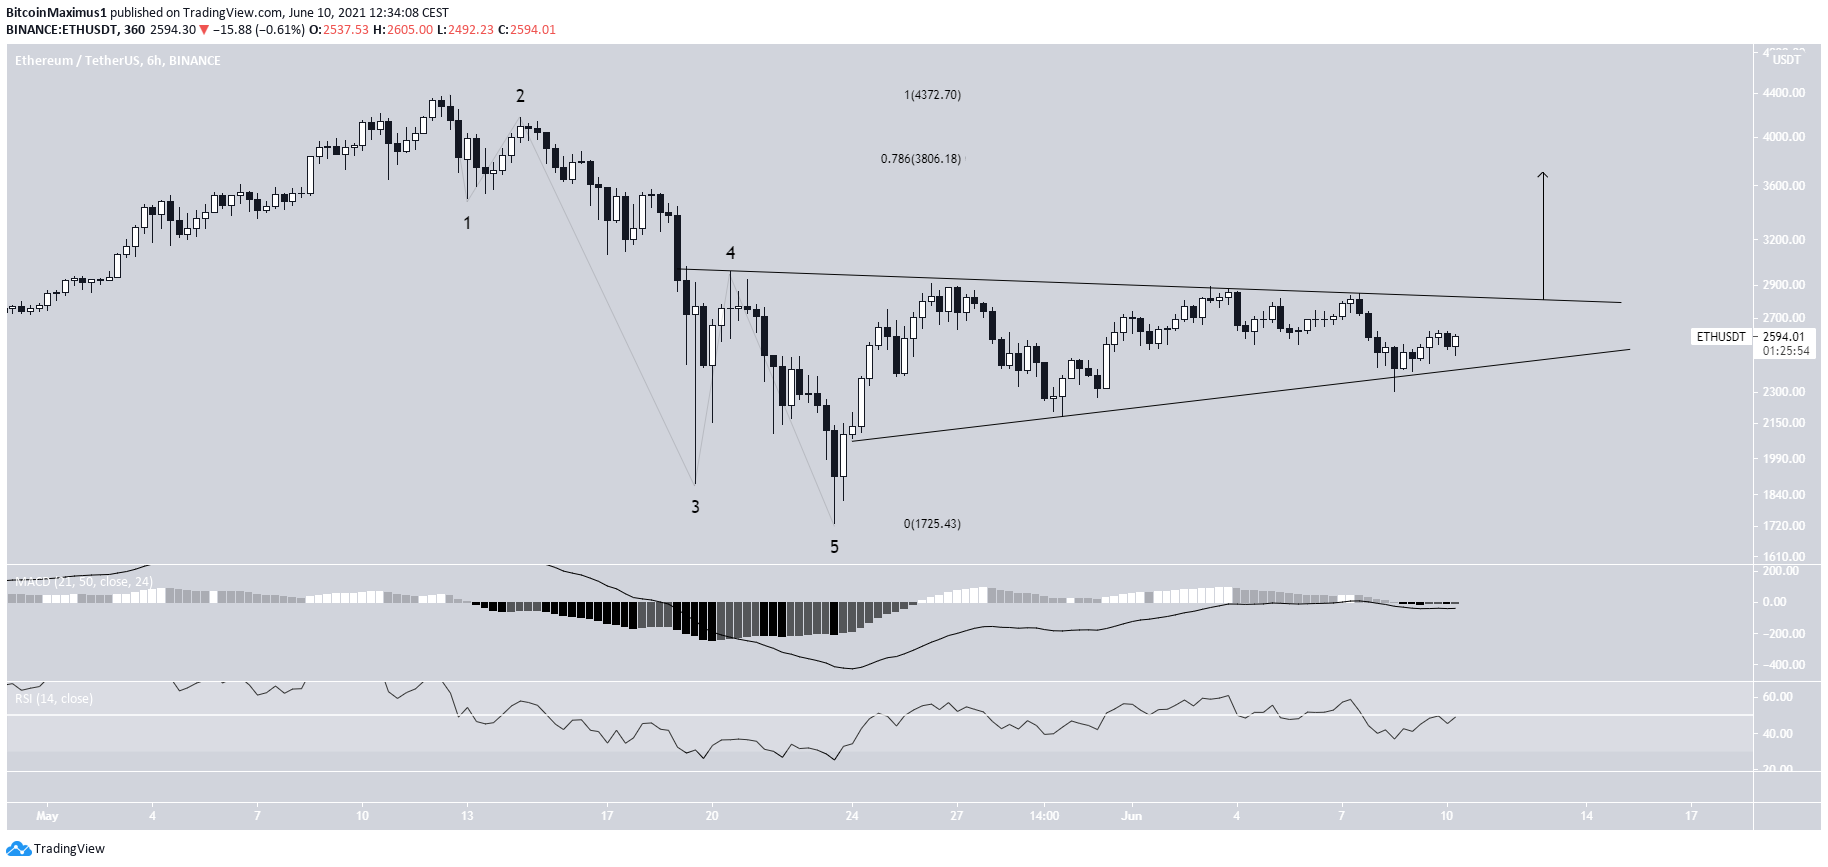
ETH has been increasing since bouncing at the $2,050 support on May 19. So far, it’s reached a local high of $2,910.
Since May 20, ETH appears to be trading inside a symmetrical triangle, which is often considered a neutral pattern. Furthermore, both the RSI and MACD are neutral. The former has crossed above and below 50 while the latter is at the 0-line.
The decrease from the all-time highs looks like a five-wave structure. A breakout that travels the entire height of the triangle could take ETH to $3,806. This is the 0.786 Fib retracement resistance level.
XRP
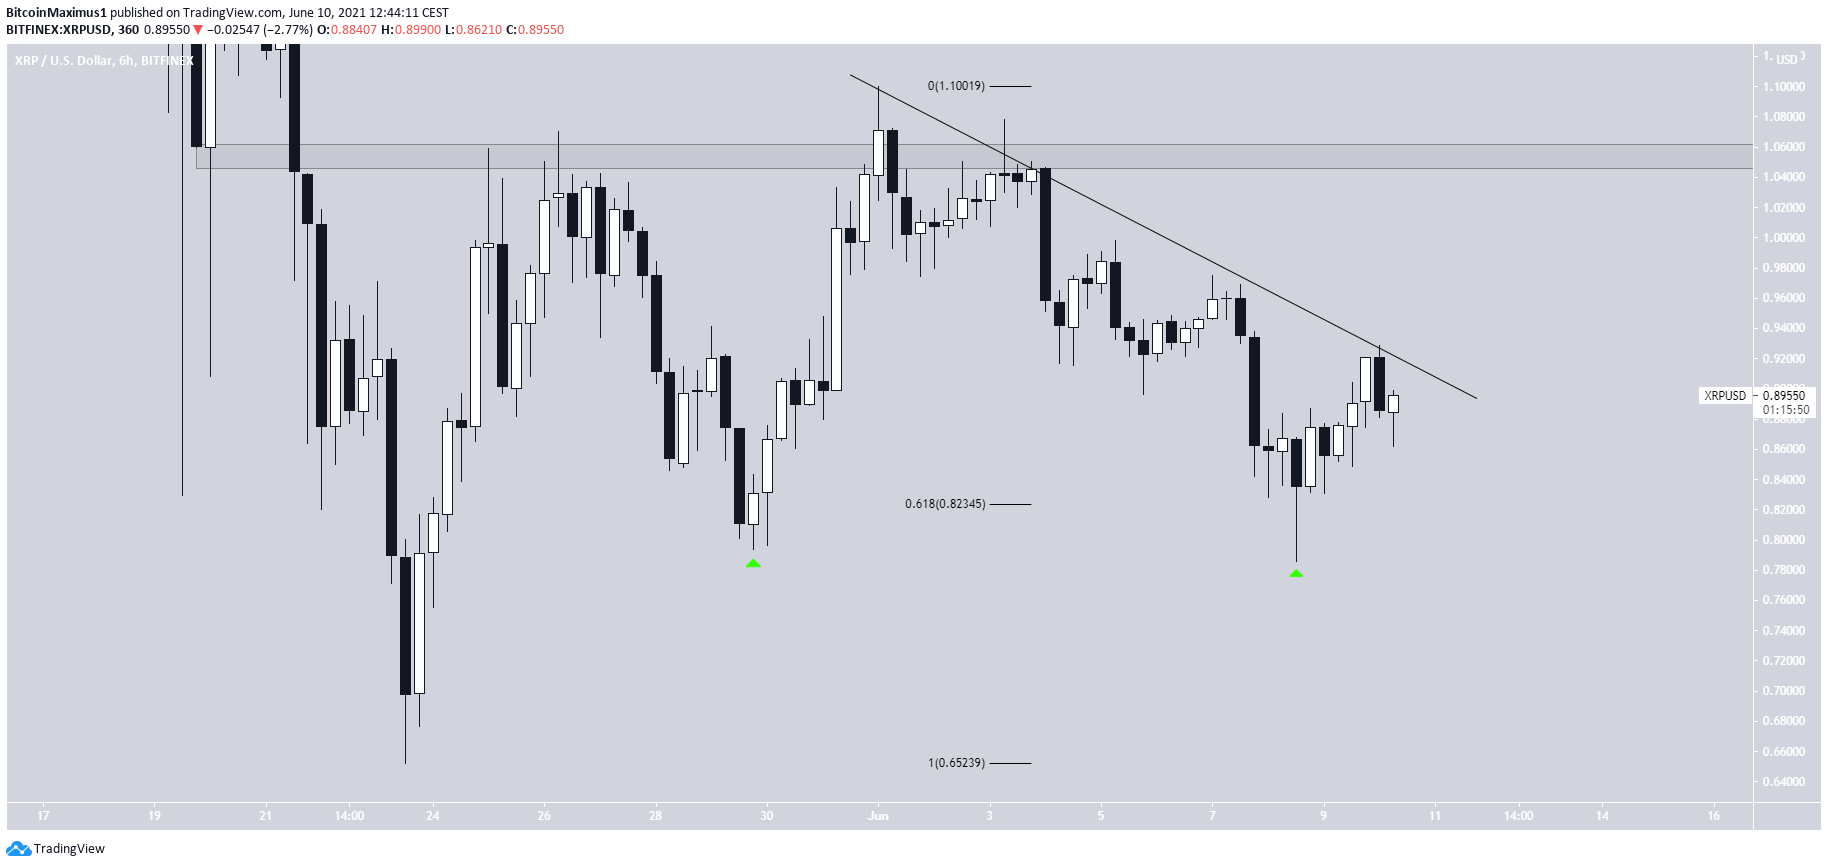
XRP has been increasing since May 23 after it reached a local low of $0.65 and bounced. So far, it has reached a high of $1.07 on May 26. It has been decreasing alongside a descending resistance line since.
XRP bounced at the 0.618 Fib retracement support level on June 8. Relative to the movement on May 29, it has created a double bottom pattern.
Currently, XRP is making an attempt at breaking out from the resistance line.
If successful, it would likely revisit the $1.05 area once more.
ZEC
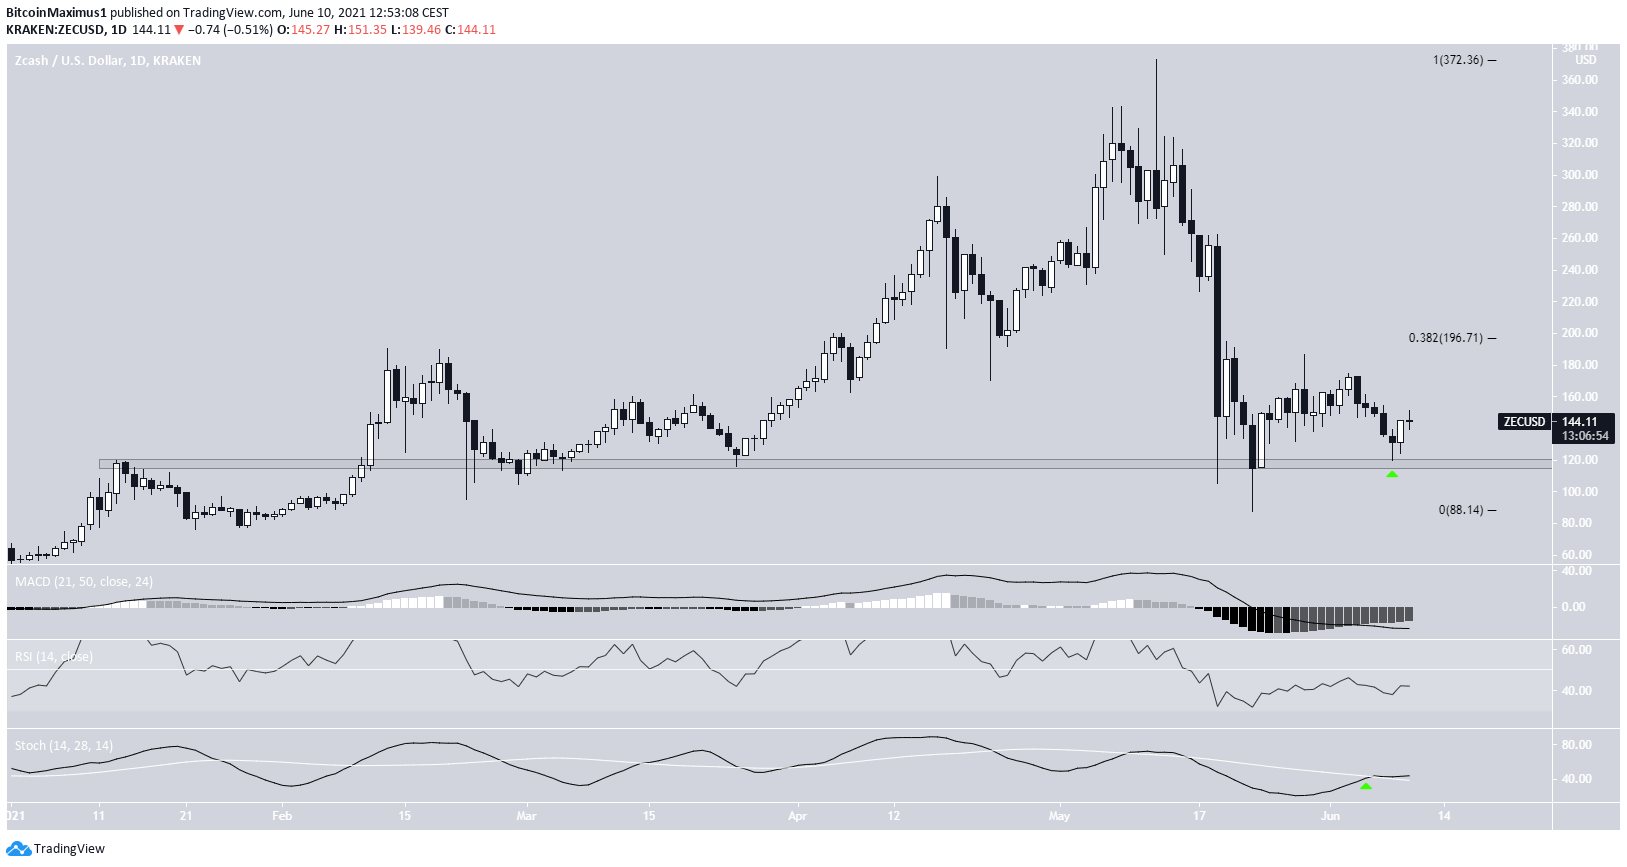
On May 19, ZEC bounced after reaching a low of $105 and reclaimed the $120 support area shortly after.
Currently, it’s in the process of validating the area as support once again. If successful, it would also create a higher low in the process.
Furthermore, technical indicators in the daily time frame are providing bullish signs, such as the bullish cross in the Stochastic oscillator. In addition, the MACD histogram is moving upwards.
The next closest resistance area is found at $197.
TFUEL
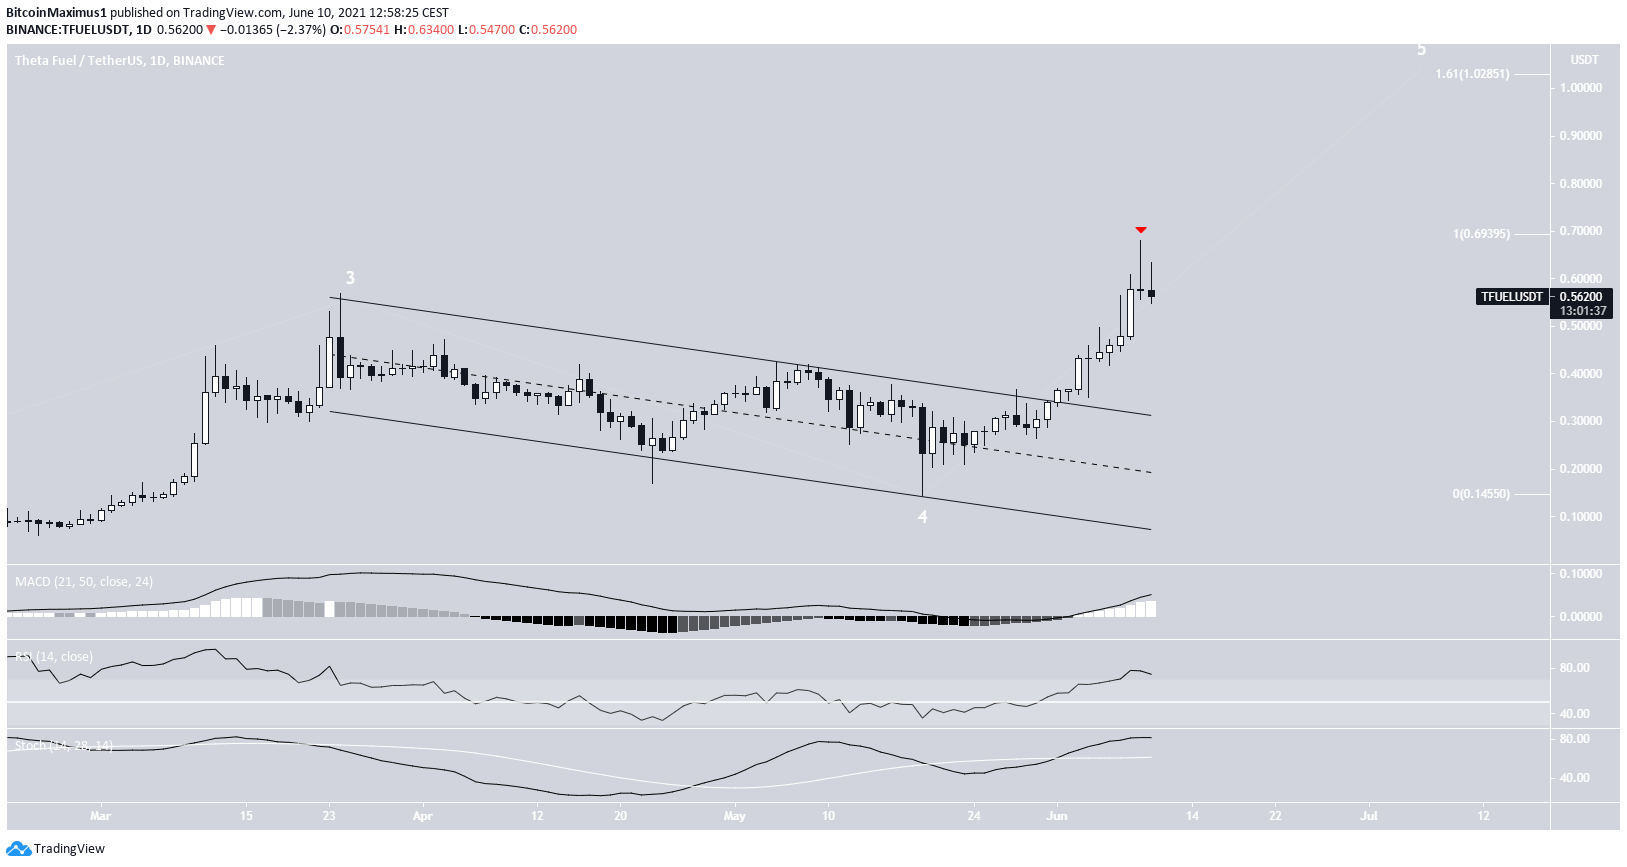
On June 1, TFUEL broke out from a descending parallel channel. It continued to increase until it reached a new all-time high price of $0.679 on June 9. It created a shooting star candlestick the same day.
As outlined previously, this was a potential target for the top of the upward move. If it extends, the next most likely target is found at $1.02.
Technical indicators are bullish, even though they are showing slightly overbought conditions.
YFI
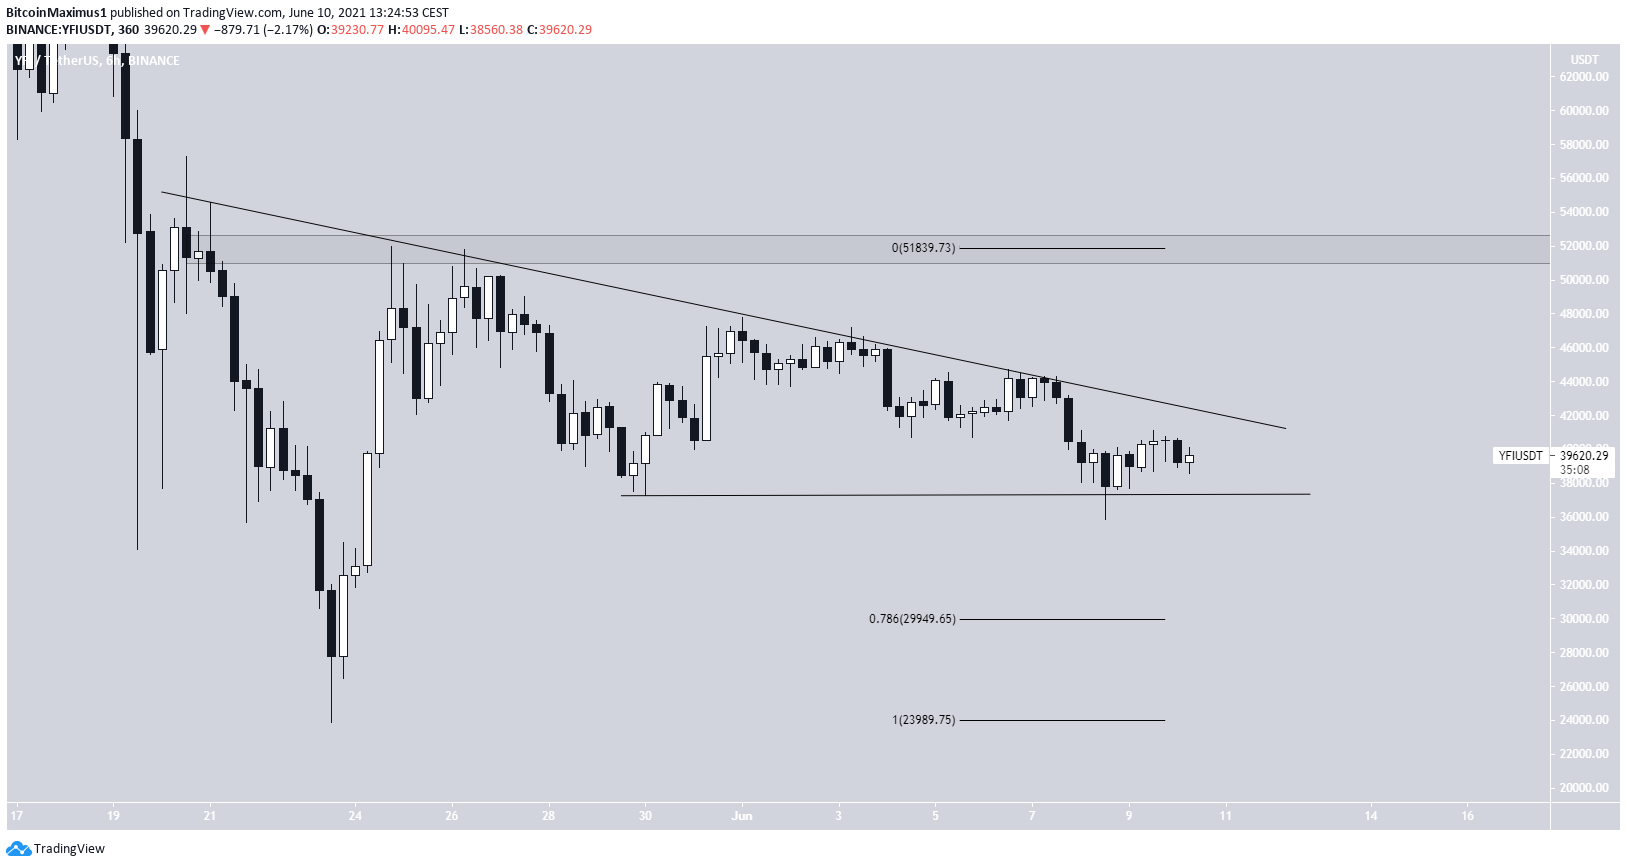
YFI has been increasing since bouncing on May 23. The increase took it to $51,963 the next day. However, this only served to validate a descending resistance line, which has been in place since May 19.
Since then, the resistance line has rejected YFI three more times. Furthermore, it’s possible that YFI is trading inside a descending triangle, which is normally considered a bearish reversal pattern.
A breakdown from the triangle could take YFI back to the $29,950 support area, while a breakout could take it towards the $51,840 area.
QTUM
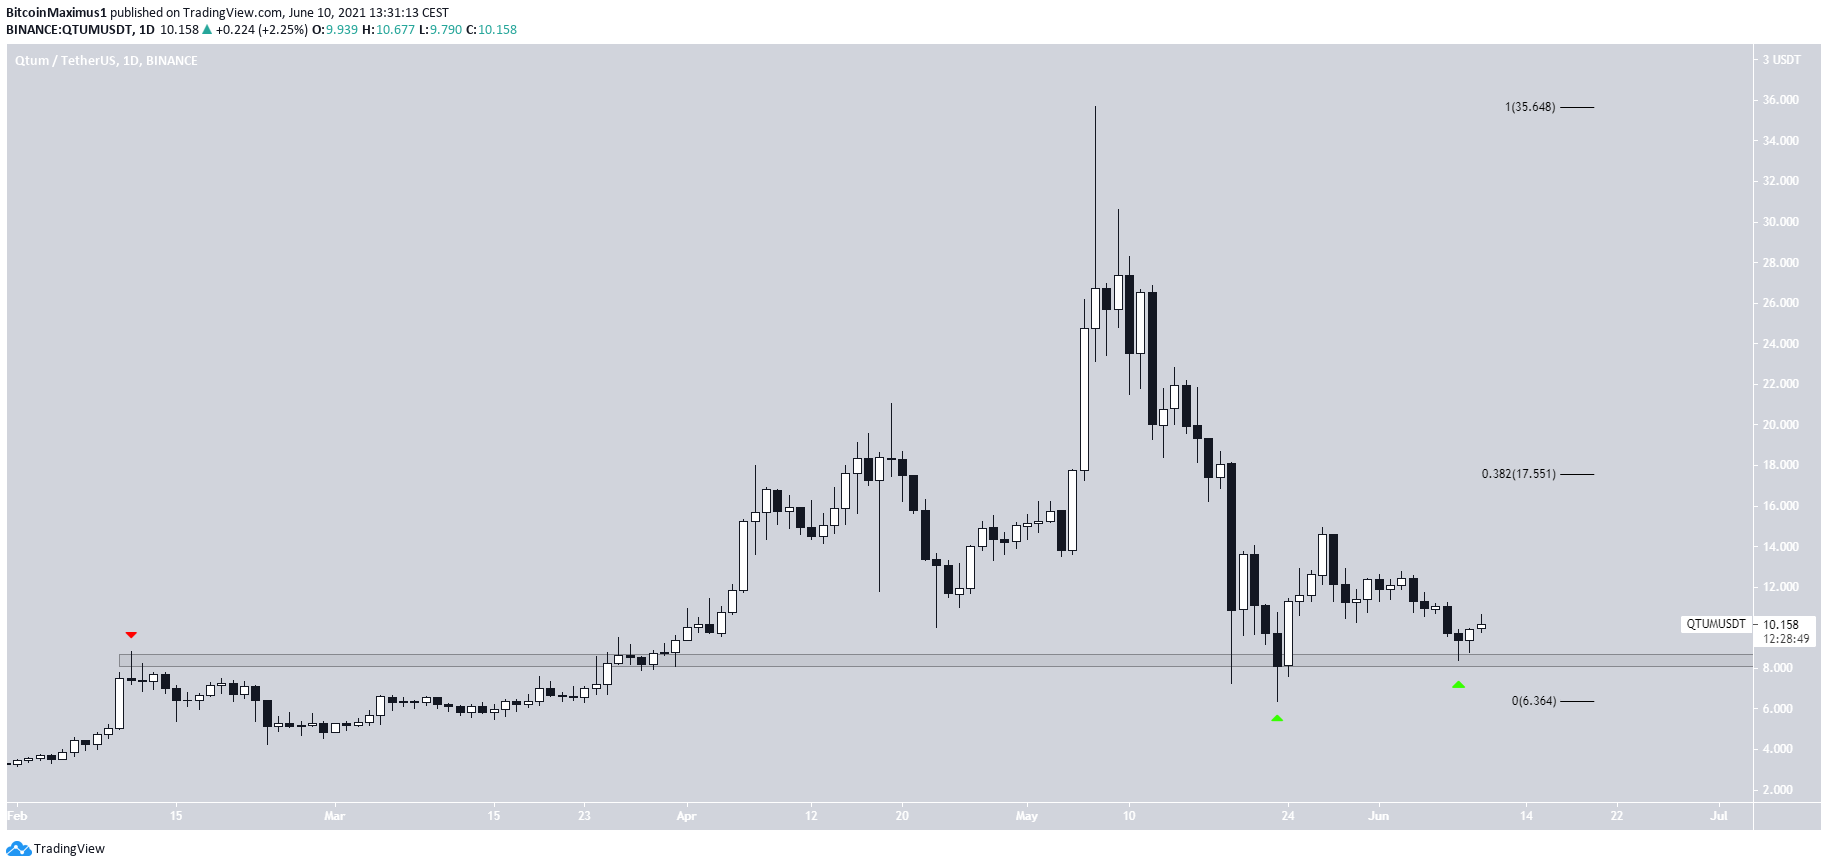
On May 23, QTUM reached a low of $6.37 and bounced.
Currently, it’s in the process of validating the $8.40 area as support once again (green icons) and is creating a higher low in the process.
If successful, the next closest resistance area would be at $17.55. This is the 0.382 Fib retracement resistance level.
For BeInCrypto’s latest BTC (BTC) analysis, click here.
The post BTC, ETH, XRP, ZEC, TFUEL, YFI, QTUM—Technical Analysis June 10 appeared first on BeInCrypto.


