BTC On-Chain Analysis: Long-Term Holders Remain Dormant During Bounce
3 min readBeInCrypto takes a look at on-chain indicators for BTC (BTC), more specifically the Coin Days Destroyed (CDD) indicator. This indicator is analyzed to determine the age of coins being transacted and if long-term holders are exiting during the recent price rebound
Several versions of the CDD show lower-than-average values — a sign that old coins are not being transacted. Therefore, long-term holders don’t appear to be exiting the market during the current bounce.
CDD
CDD is an indicator which measures how long a BTC remains unspent prior to being transacted. Each day that it remains unspent, it accumulates one “coin day.” When the coin is transacted, these accumulated days are destroyed.
The CDD reading shows how many coin days are destroyed each day. A high reading indicates that coins that were previously dormant for a significant period of time are now being moved. This typically occurs during significant price increases and during bounces after sharp drops.
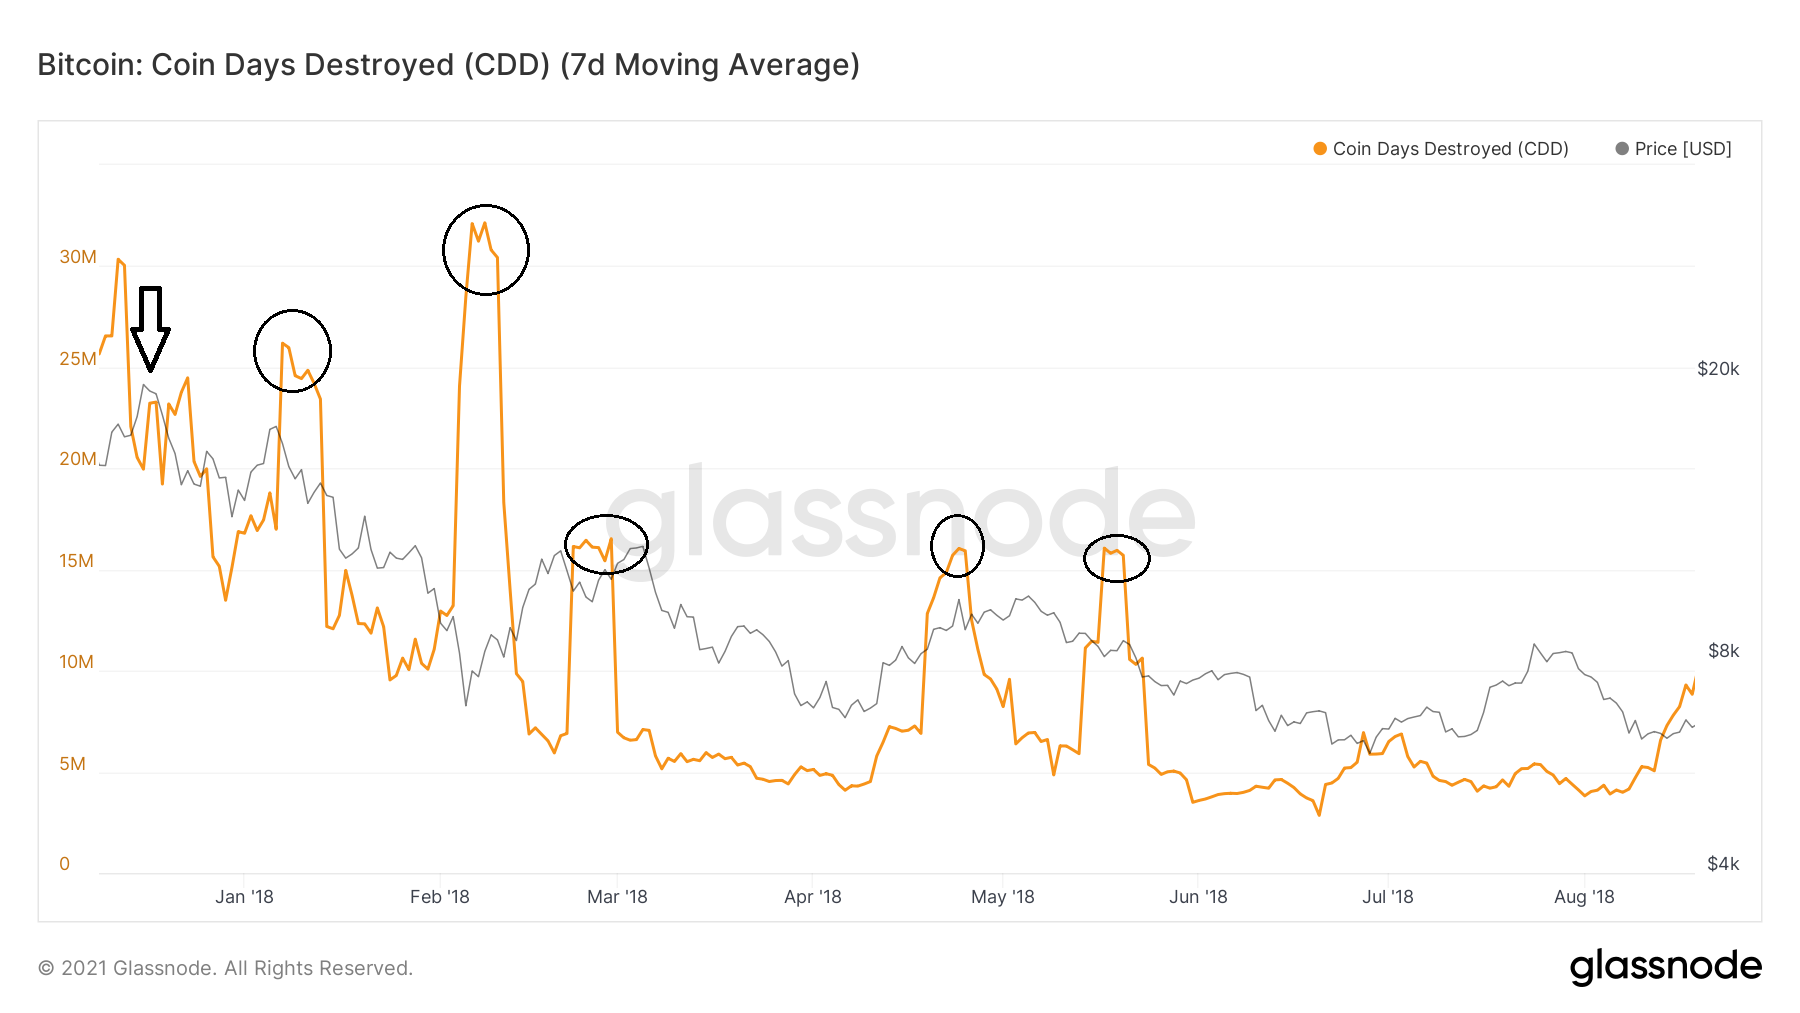
After the 2017 BTC top was reached (black arrow), the CDD spiked considerably numerous times. This was a sign of old coins exiting the rally on almost every bounce. In hindsight, it meant that old coins were using these spikes in order to exit the market prior to the continuation of the correction.
During this period, the CDD spiked five times (black circles), reaching values between 16.5 million and 32.2 million.

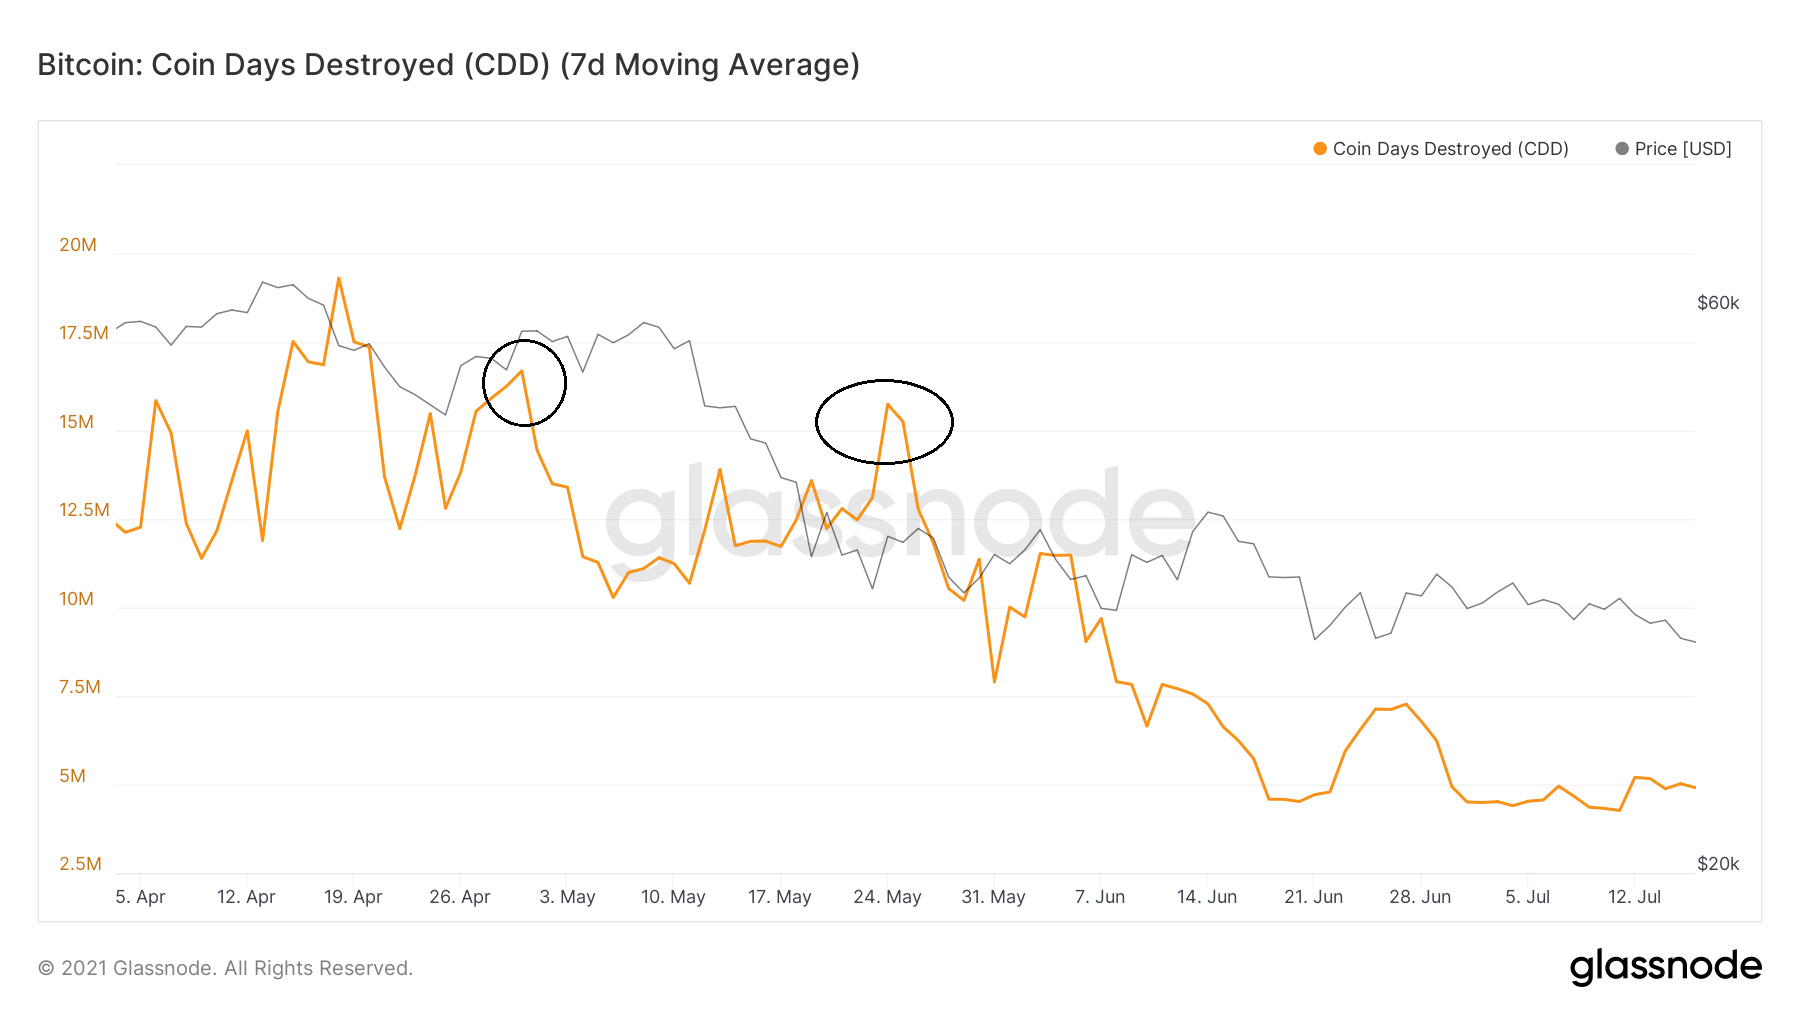
However, the same thing has not occurred after the 2021 top. While CDD reached a high of 19.3 million at the time of the top, it has moved above 15 million only twice during the correction, on April 30 and May 24.
Therefore, unlike during the 2017 correction, old coins are not exiting during the bounce, despite the significant drop since the $64,437 all-time high BTC price.

Binary CDD
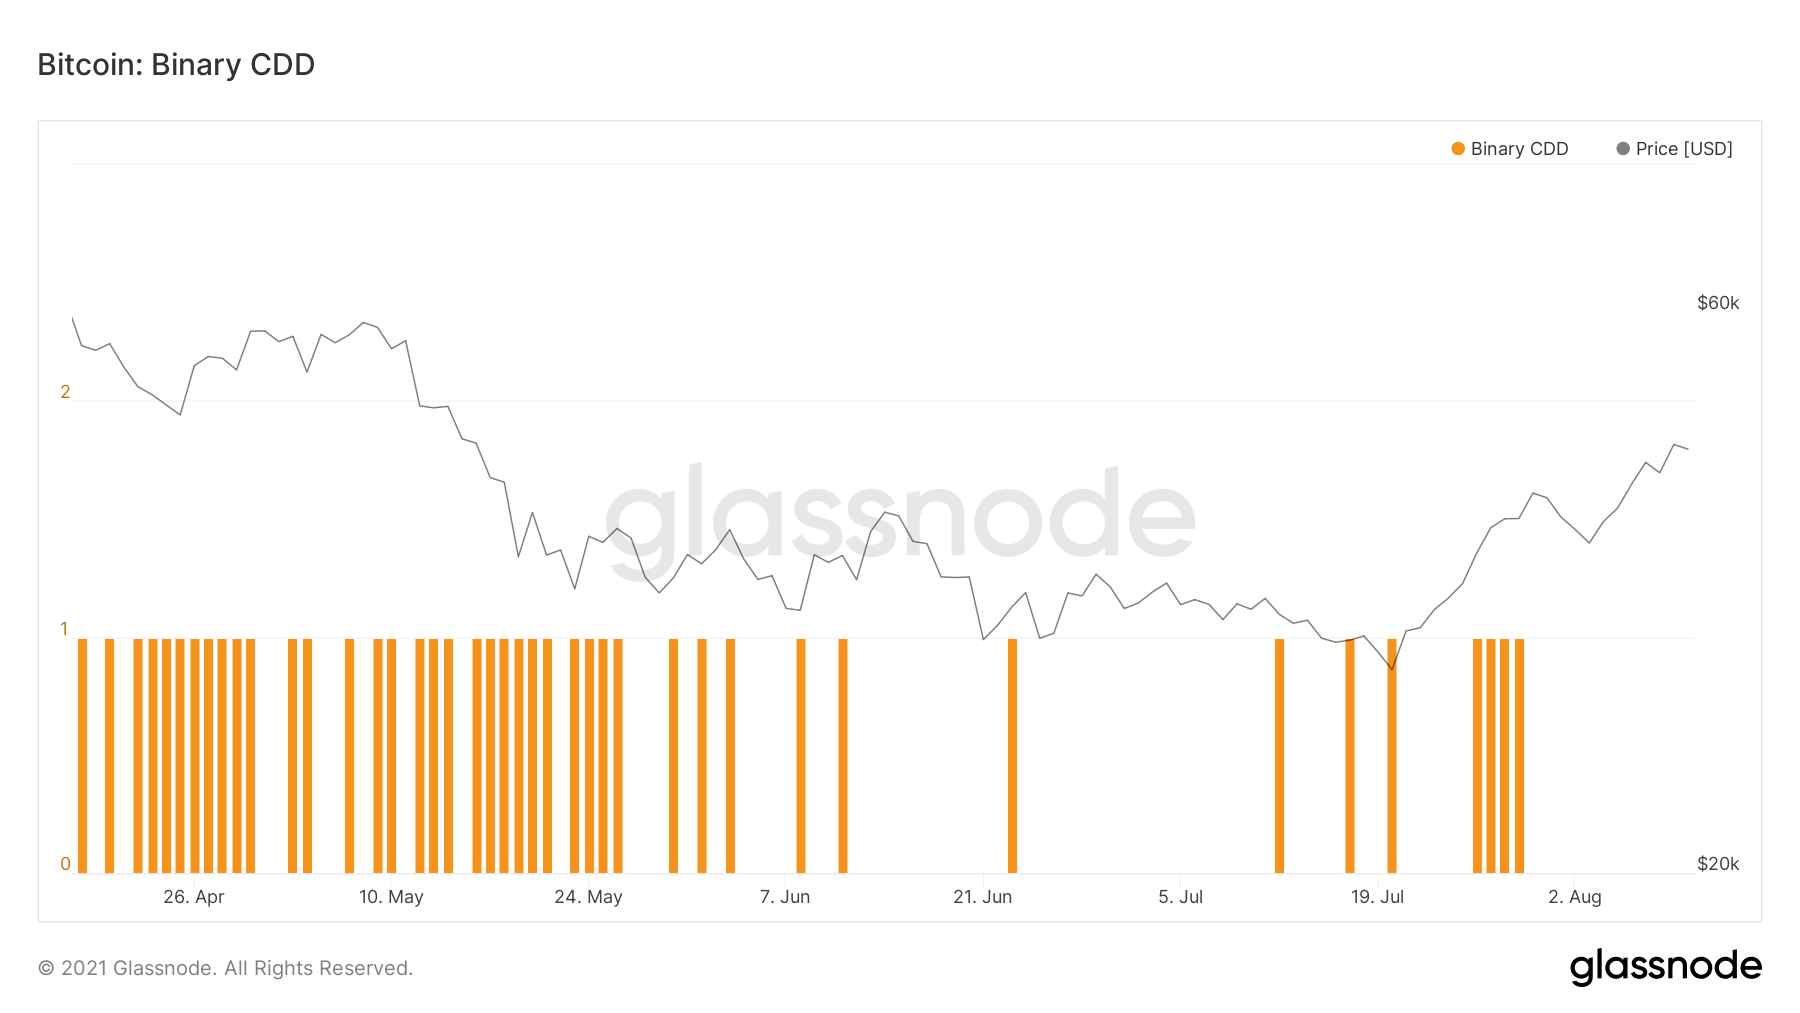
Binary CDD is an indicator that measures whether each specific day had a higher than average coin days destroyed reading. It gives a value of one if the CDD for the day was higher than the average CDD. Conversely, it gives a value of zero if it is not.
Since July 30, no single day has had an above average days destroyed, indicating that less and less old coins are being transacted.

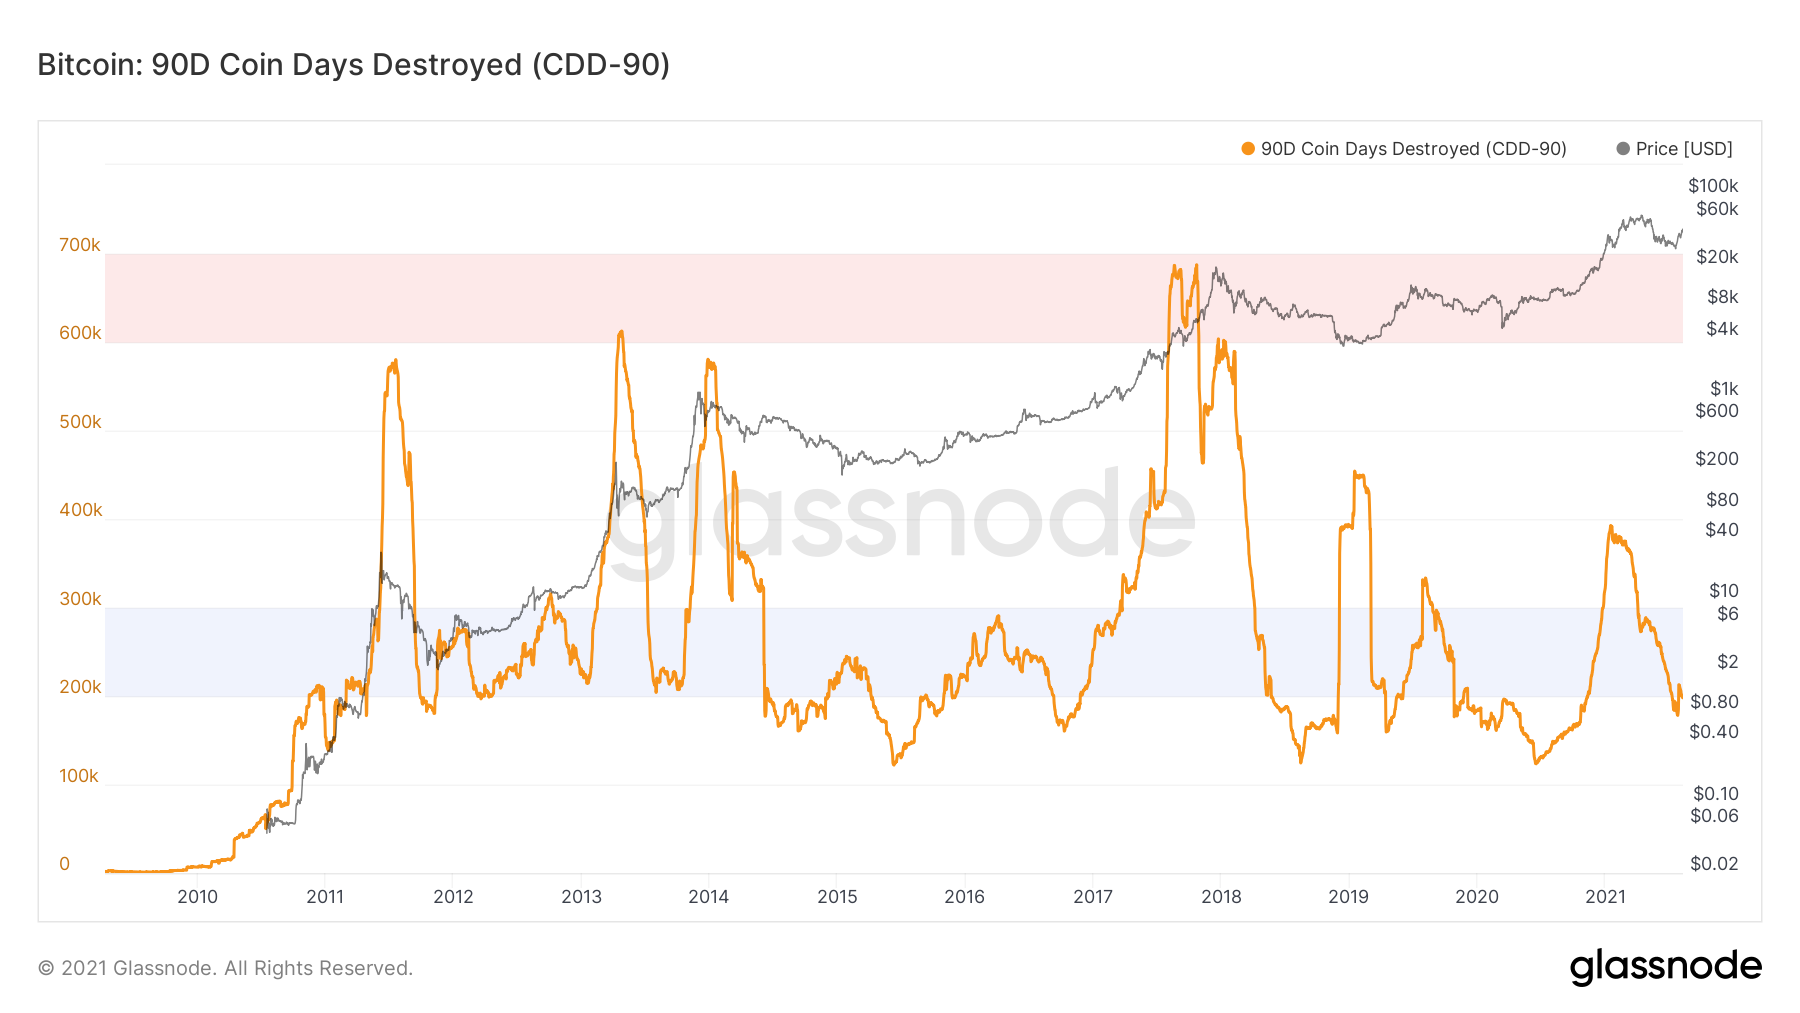
In addition to this, a similar reading is given by 90-day coin days destroyed indicator, which is a rolling sum of CDD. It shows a relatively low value of 197,975. This is below the 200,000 lower threshold.
Furthermore, the reading is in stark contrast with those after the beginning of BTC corrections in both 2013 and 2017.
Both times, the 90-day CDD spiked considerably, indicating what was a exit rally for old coins prior to the continuation of the drop. In 2013, it reached values of 580,000, while it went even higher to 600,000 in 2017 (black arrows).
Therefore, almost all versions of CDD show readings that are dissimilar to relief rallies prior to the beginning of long-term corrections. A similar reading is also seen in the NUPL.

For BeInCrypto’s latest BTC (BTC) analysis, click here.
The post BTC On-Chain Analysis: Long-Term Holders Remain Dormant During Bounce appeared first on BeInCrypto.


