BTC On-Chain Analysis: Mining Indicators Suggest BTC Close to a Bottom
3 min readBeInCrypto looks at on-chain BTC (BTC) data as it relates to miners. More specifically, the difficulty ribbon compression, the hash ribbon, and the Puell multiple metrics are analyzed.
Both the difficulty and hash ribbons show values that have historically been associated with bottoms. In addition, the Puell multiple suggests that the bull run has not yet reached a high.
BTC difficulty ribbon compression
The Difficulty ribbon is an indicator that creates a band of moving averages (MA) of the BTC mining difficulty. This metric is the estimated number of hashes for mining a block.
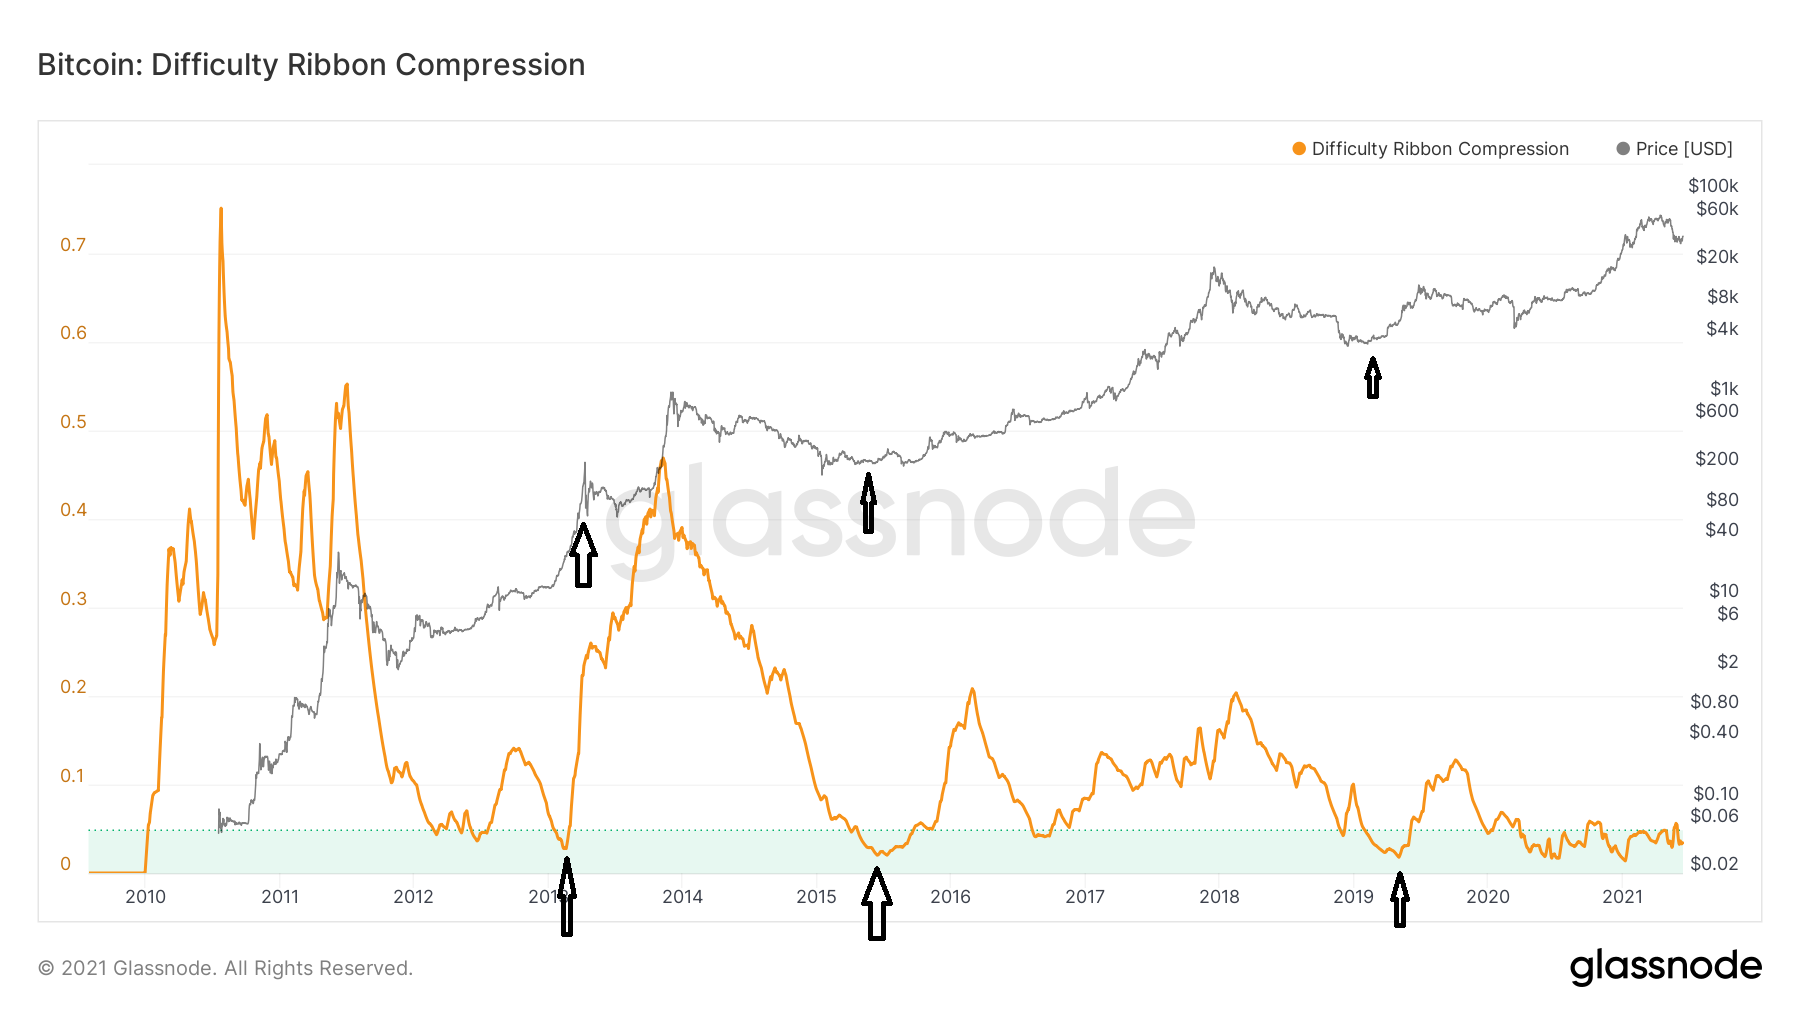
Difficulty ribbon compression uses a normalized standard deviation in order to quantify the values given by the difficulty ribbon. Low values (those between 0.01 and 0.05) have historically represented periods close to the bottom.
The three most notable dips inside this area occurred in January 2013, August 2015, and April 2019, preceding significant BTC price increases.
With the exception of two short-lived periods above 0.05, the difficulty ribbon has stayed inside this threshold since April 2020 and is currently at 0.034.

Hash ribbon values
BTC’s difficulty is adjusted every 2016 blocks. This amounts to an adjustment roughly every two weeks.
On the other hand, BTC’s hash rate is calculated each day. This value is based on the number of blocks found by miners each day. Therefore, the difficulty lags the hash rate by two weeks, since the latter is calculated daily, while the former is adjusted once every two weeks.
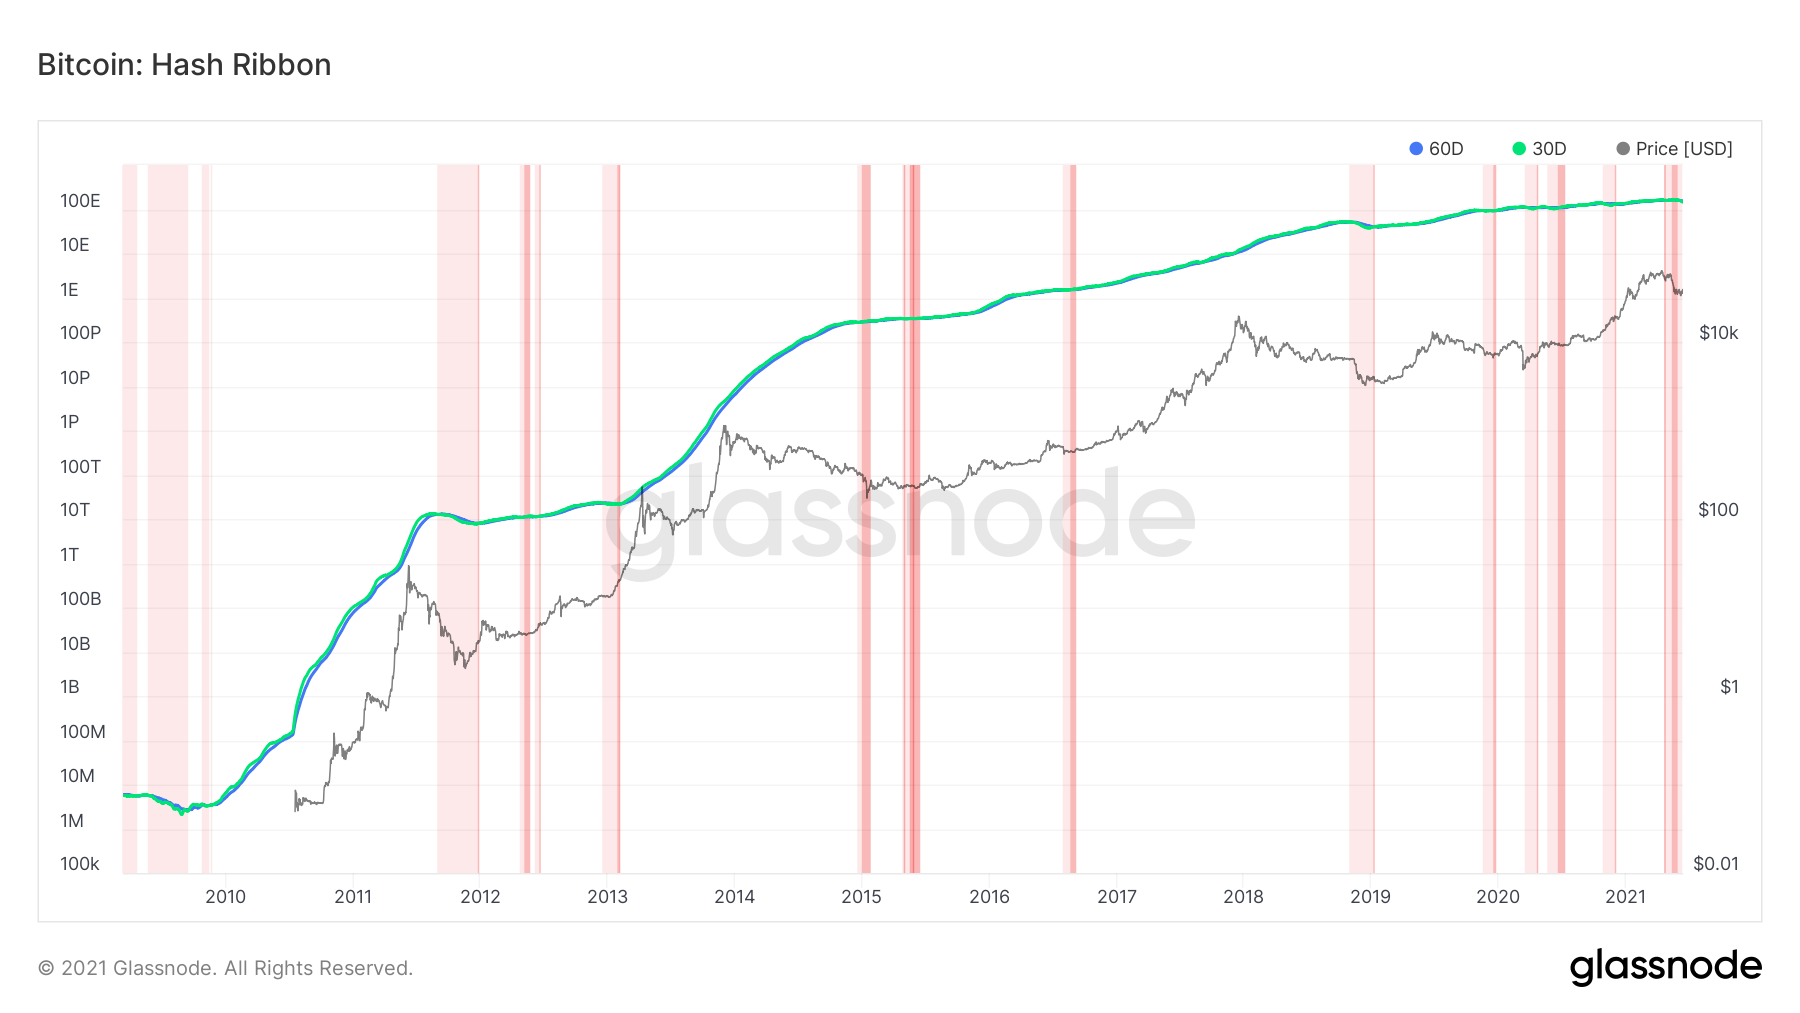
The hash ribbon is an indicator that uses the hash rate in order to determine miner capitulation, meaning that the cost of mining is higher than the rewards. It does that by using a 30-day and 60-day MAs of the hash rate. In the chart below, a cross between the MAs is represented by a shift from light to dark red. Historically, these values have represented bottoms.
The indicator has been dark red from May 17 to June 3 and is now back in light red. Nonetheless, it has been some shade of red since the beginning of April.
The only other periods that miners capitulated for such a long time were between August 2011-January 2020 and November 2018-January 2019.

Puell multiple
The Puell Multiple is an indicator that divides the dollar value of all coins minted in a single day with a yearly moving average.
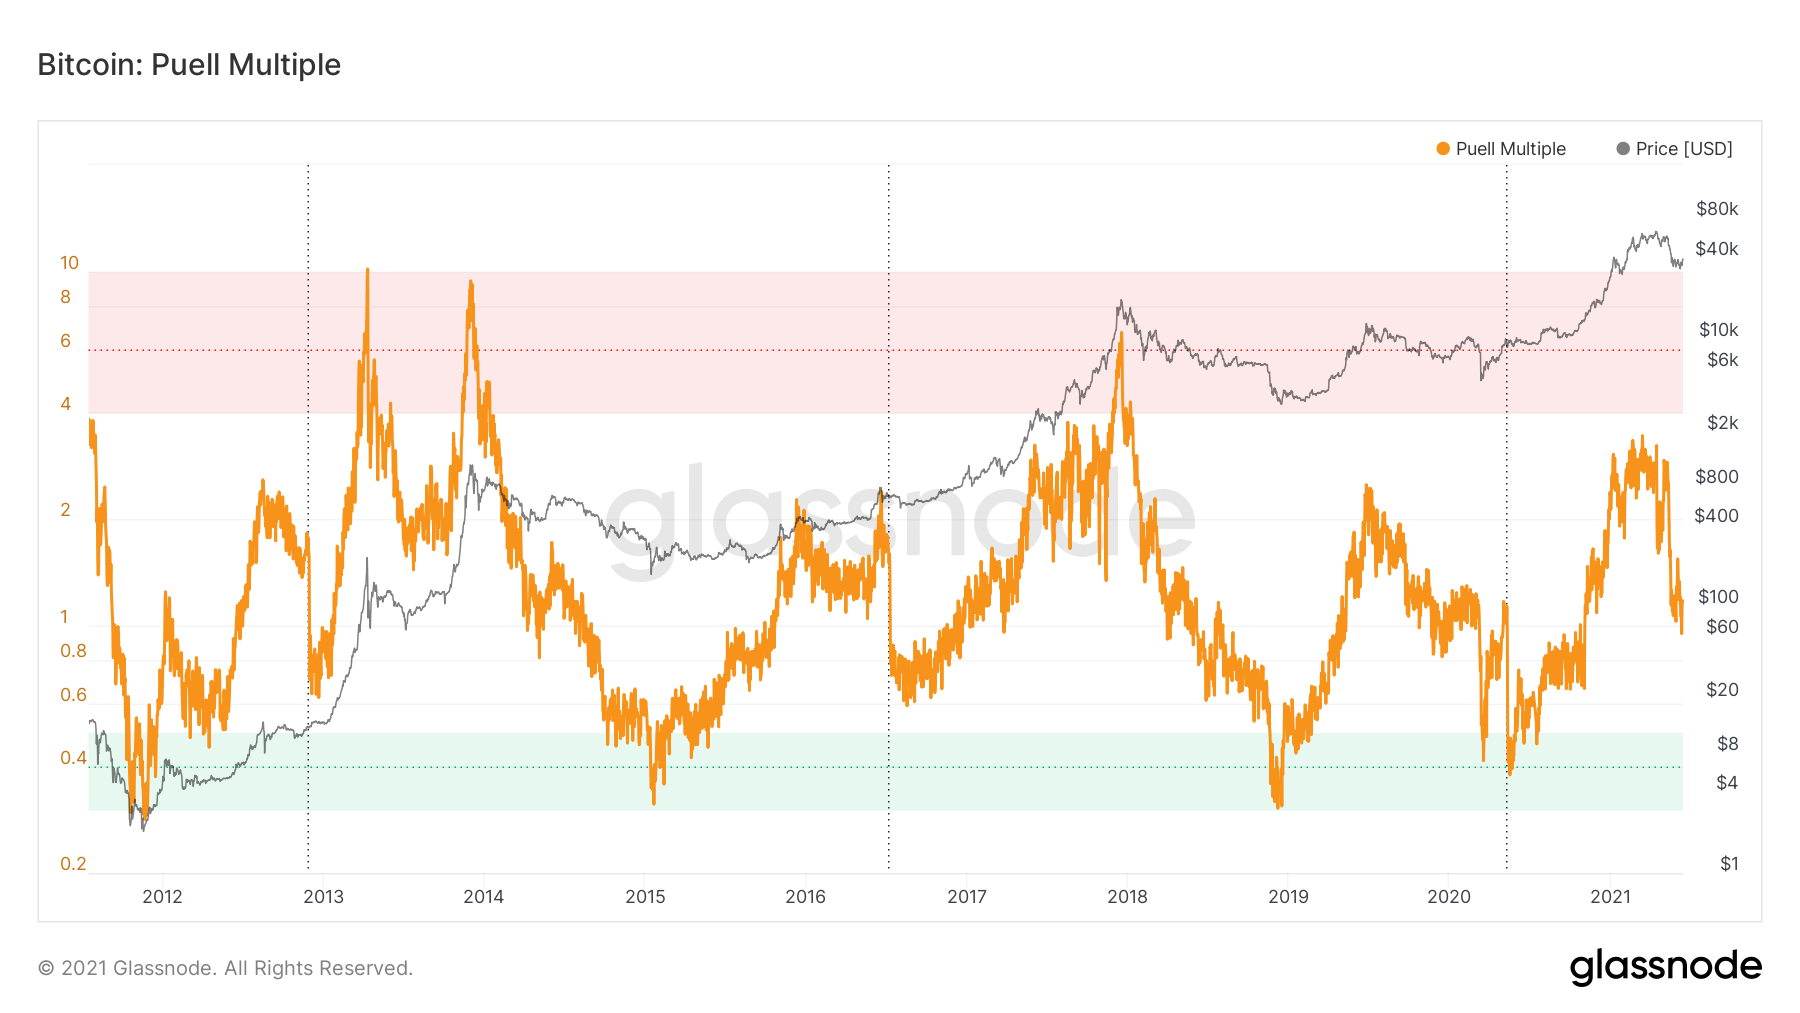
A high profitability value occurs when current income is considerably above the yearly average. High values are considered those between 4 and 10. In the chart below, these are highlighted in red.
Historically, tops have occurred when this indicator reaches values inside this area.
- The April 2013 high had a value of 10.1
- The December 2013 high had a value of 9.41
- The December 2017 high had a value of 6.72
The current Puell Multiple value is 1.17 while the yearly high so far has been 3.43, reached on March 14. Therefore, it has not yet reached the 4-10 level.
If the bull run were to end, it would be the first time in recorded history in which the Puell Multiple has not reached a value between 4-10 before a top.

For BeInCrypto’s latest BTC (BTC) analysis, click here.
The post BTC On-Chain Analysis: Mining Indicators Suggest BTC Close to a Bottom appeared first on BeInCrypto.


