BTC On-Chain Analysis: Stock-to-Flow and SSR Show Undervaluation
2 min readA look at on-chain indicators for BTC (BTC), more specifically the deflection from the Stock-to-Flow (STF) model and the Stablecoin Supply Ratio (SSR).
The STF model shows the second-highest deflection in recorded history, while SSR has fallen below the lower Bollinger Band for the fourth time in three years.
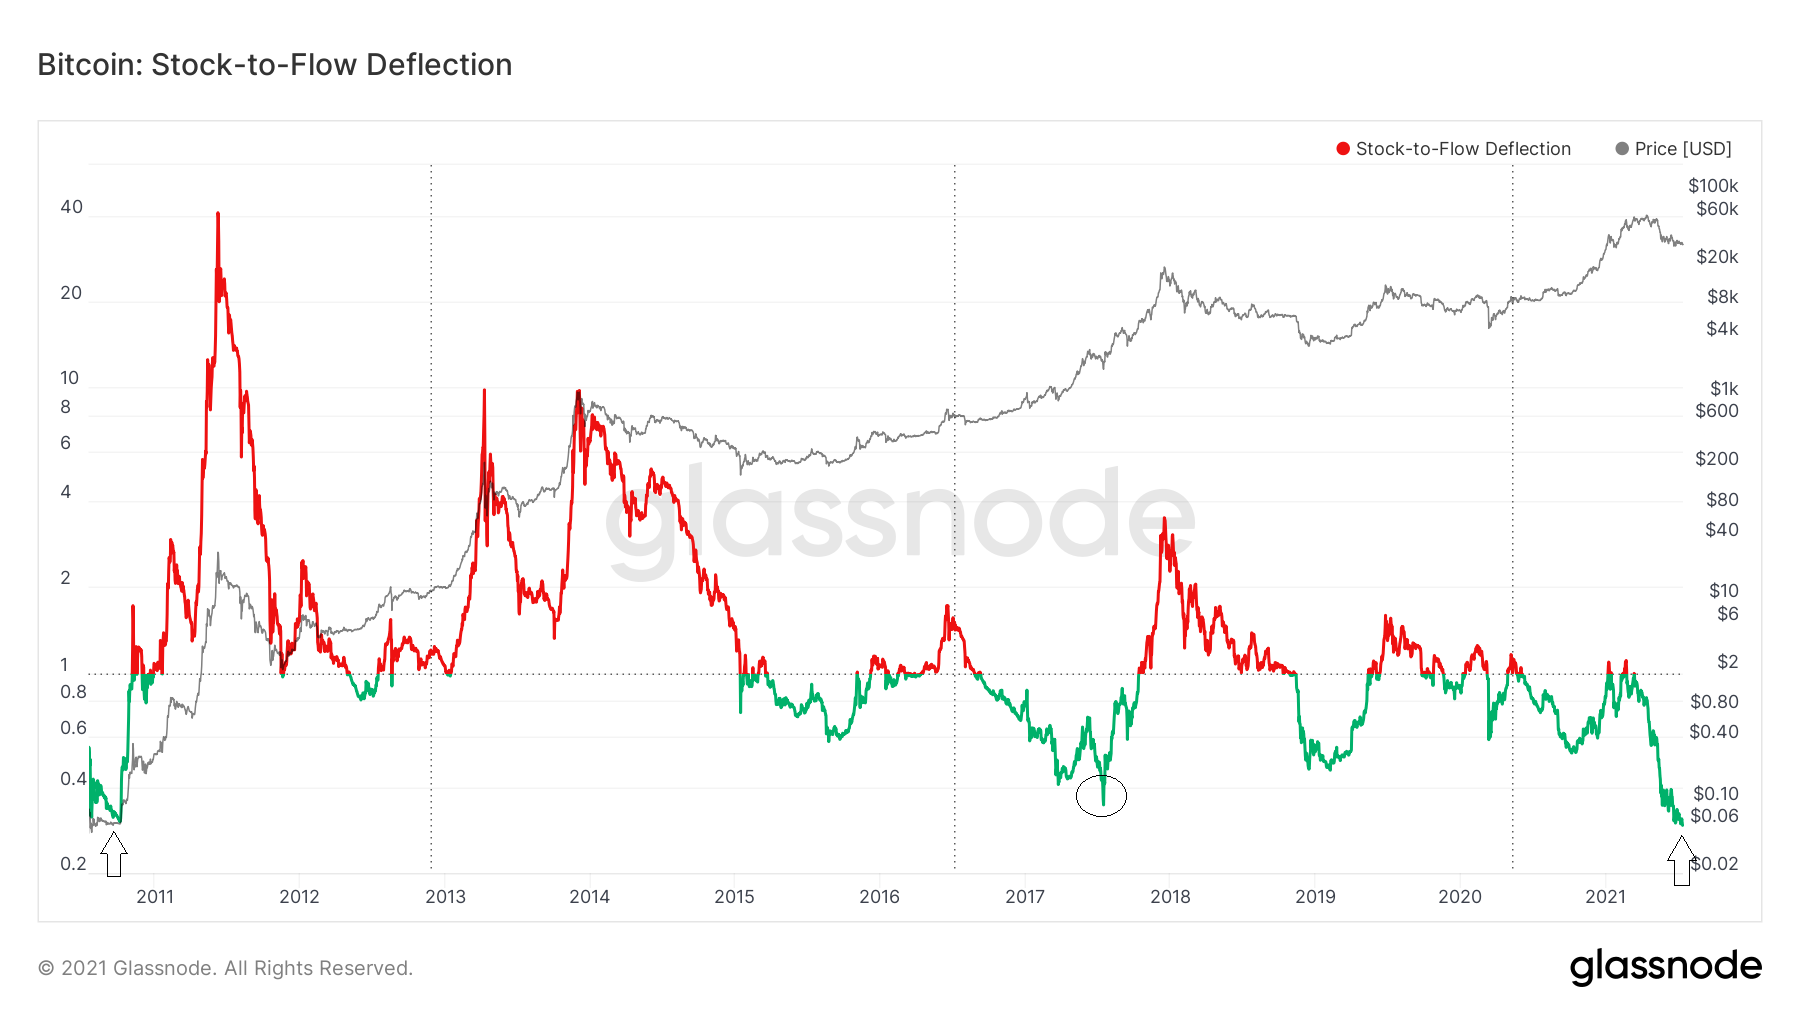
Stock-to-Flow model
The STF deflection is the difference between the BTC price and the STF model.
A value higher than one (red line) indicates that BTC is overvalued relative to the model. Conversely, a value lower than one (green line) suggests that it is undervalued instead.
So far, the lowest ever value has been recorded in Nov. 2020, at 0.3 (black arrow). More recently, July 2017 had a 0.36 value (black circle).
However, the recent BTC price decrease has caused the STF deflection to fall all the way to 0.314, the lowest value in roughly ten years.
Therefore, according to the STF model, the current BTC price shows extreme undervaluation.

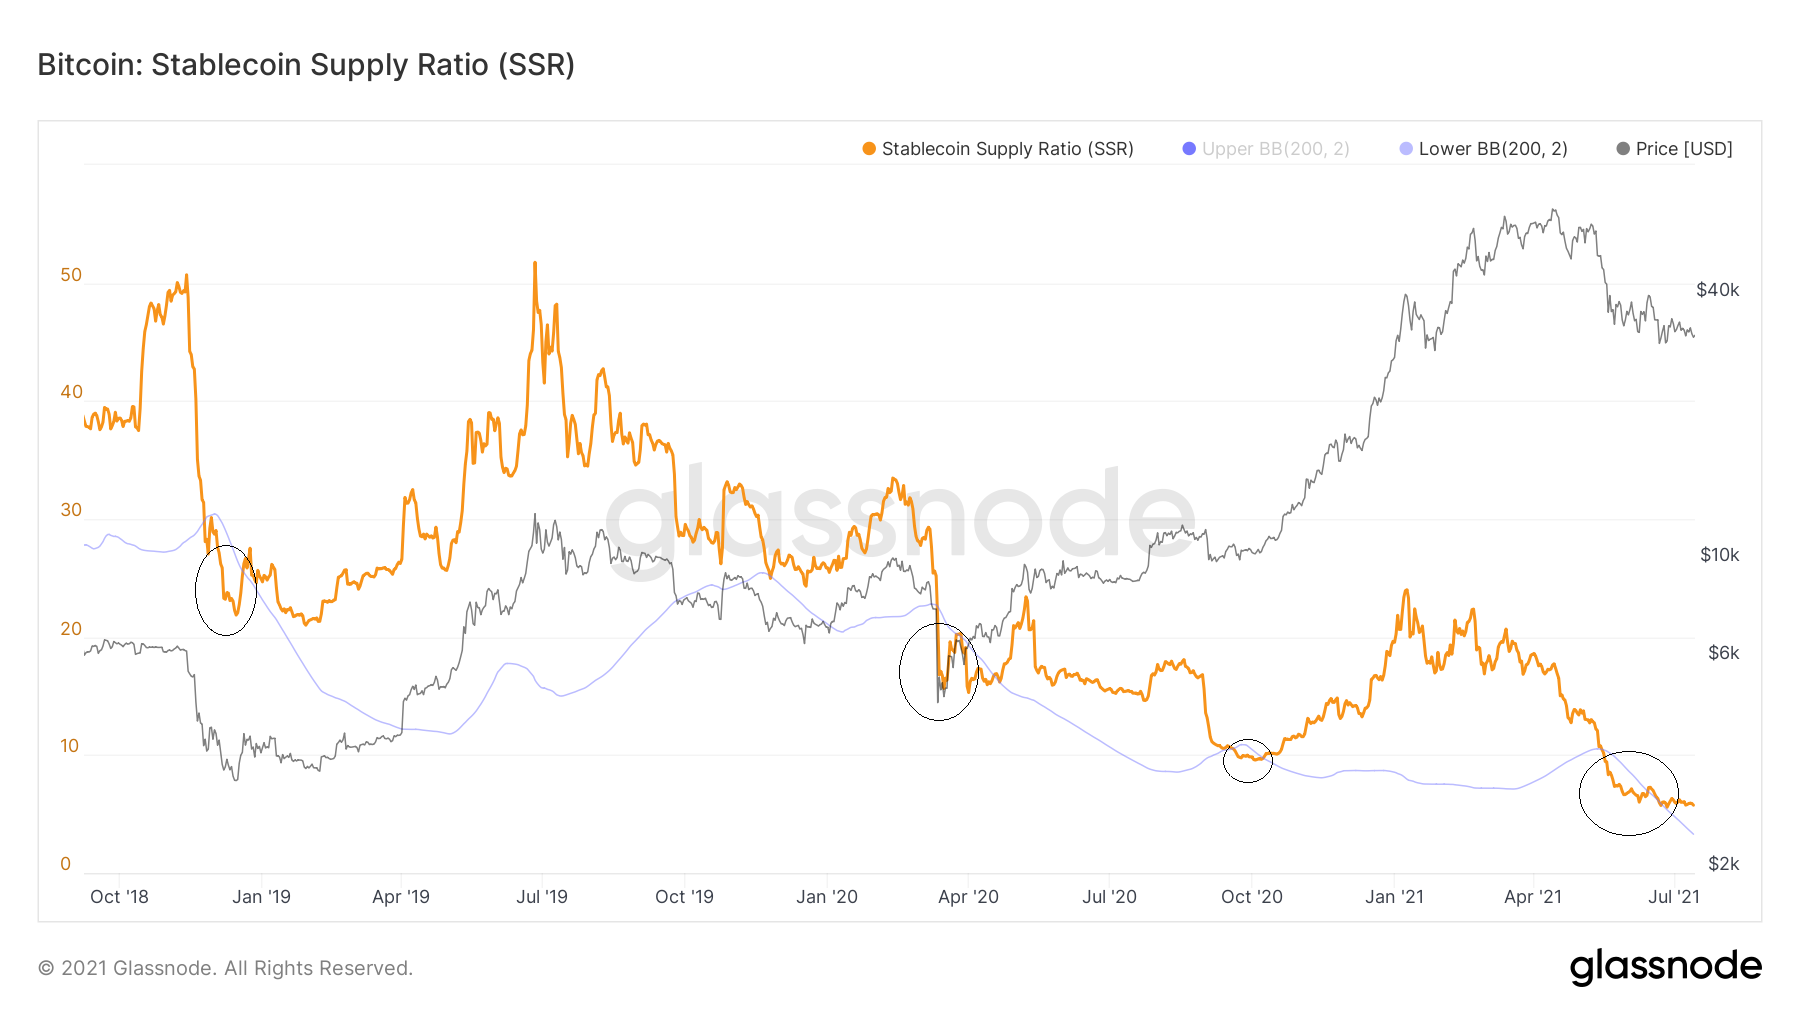
Stablecoin Supply Ratio for BTC
SSR measures the ratio between the supply of BTC stablecoins. It increases/decreases with a change in the price of BTC or the total supply of stablecoins.
A low SSR value indicates that a high percentage of the supply of BTC can be bought with stablecoins. More specifically, a value of 5 indicates that 20% of the BTC supply can be bought by stablecoins (1/5).
SSR has been making new all-time lows since May 17, when it first reached a value of 9.4. This was just slightly below the previous all-time low of 9.57, reached in Oct. 2020.
On June 26, SSR reached a new all-time low of 5.56.
Another interesting development is that SSR has fallen below the lower Bollinger Band for the fourth time since Oct. 2018.
The previous three times (circles) marked bottoms before significant upward movements.
Therefore, if previous history is any indication, BTC is likely to initiate another upward movement soon.

For BeInCrypto’s latest BTC (BTC) analysis, click here.
The post BTC On-Chain Analysis: Stock-to-Flow and SSR Show Undervaluation appeared first on BeInCrypto.


